
How big is YouTube?
I got interested in this question a few years ago, when I started writing about the “denominator problem”. A great deal of social media research focuses on finding unwanted behavior – mis/disinformation, hate speech – on platforms. This isn’t that hard to do: search for “white genocide” or “ivermectin” and count the results. Indeed, a lot of eye-catching research does just this – consider Avaaz’s August 2020 report about COVID misinformation. It reports 3.8 billion views of COVID misinfo in a year, which is a very big number. But it’s a numerator without a denominator – Facebook generates dozens or hundreds of views a day for each of its 3 billion users – 3.8 billion views is actually a very small number, contextualized with a denominator.
A few social media platforms have made it possible to calculate denominators. Reddit, for many years, permitted Pushshift to collect all Reddit posts, which means we can calculate what a small fraction of Reddit is focused on meme stocks or crypto, versus conversations about mental health or board gaming. Our Redditmap.social platform – primarily built by Virginia Partridge and Jasmine Mangat – is based around the idea of looking at the platform as a whole and understanding how big or small each community is compared to the whole. Alas, Reddit cut off public access to Pushshift this summer, so Redditmap.social can only use data generated early this year.
Twitter was also a good platform for studying denominators, because it created a research API that took a statistical sample of all tweets and gave researchers access to every 10th or 100th one. If you found 2500 tweets about ivermectin a day, and saw 100m tweets through the decahose (which gave researchers 1/10th of tweet volume), you could calculate an accurate denominator (100m x 10) (All these numbers are completely made up.) Twitter has cut off access to these excellent academic APIs and now charges massive amounts of money for much less access, which means that it’s no longer possible for most researchers to do denominator-based work.
Interesting as Reddit and Twitter are, they are much less widely used than YouTube, which is used by virtually all internet users. Pew reports that 93% of teens use YouTube – the closest service in terms of usage is Tiktok with 63% and Snapchat with 60%. While YouTube has a good, well-documented API, there’s no good way to get a random, representative sample of YouTube. Instead, most research on YouTube either studies a collection of videos (all videos on the channels of a selected set of users) or videos discovered via recommendation (start with Never Going to Give You Up, objectively the center of the internet, and collect recommended videos.) You can do excellent research with either method, but you won’t get a sample of all YouTube videos and you won’t be able to calculate the size of YouTube.
I brought this problem to Jason Baumgartner, creator of PushShift, and prince of the dark arts of data collection. One of Jason’s skills is a deep knowledge of undocumented APIs, ways of collecting data outside of official means. Most platforms have one or more undocumented APIs, widely used by programmers for that platform to build internal tools. In the case of YouTube, that API is called “Inner Tube” and its existence is an open secret in programmer communities. Using InnerTube, Jason suggested we do something that’s both really smart and really stupid: guess at random URLs and see if there are videos there.
Here’s how this works: YouTube URLs look like this: https://www.youtube.com/ watch?v=vXPJVwwEmiM
That bit after “watch?v=” is an 11 digit string. The first ten digits can be a-z,A-Z,0-9 and _-. The last digit is special, and can only be one of 16 values. Turns out there are 2^64 possible YouTube addresses, an enormous number: 18.4 quintillion. There are lots of YouTube videos, but not that many. Let’s guess for a moment that there are 1 billion YouTube videos – if you picked URLs at random, you’d only get a valid address roughly once every 18.4 billion tries.
We refer to this method as “drunk dialing”, as it’s basically as sophisticated as taking swigs from a bottle of bourbon and mashing digits on a telephone, hoping to find a human being to speak to. Jason found a couple of cheats that makes the method roughly 32,000 times as efficient, meaning our “phone call” connects lots more often. Kevin Zheng wrote a whole bunch of scripts to do the dialing, and over the course of several months, we collected more than 10,000 truly random YouTube videos.
There’s lots you can do once you’ve got those videos. Ryan McCarthy is lead author on our paper in the Journal of Quantitative Description, and he led the process of watching a thousand of these videos and hand-coding them, a massive and fascinating task. Kevin wired together his retrieval scripts with a variety of language detection systems, and we now have a defensible – if far from perfect – estimate of what languages are represented on YouTube. We’re starting some experiments to understand how the videos YouTube recommends differ from the “average” YouTube video – YouTube likes recommending videos with at least ten thousand views, while the median YouTube video has 39 views.
I’ll write at some length in the future about what we can learn from a true random sample of YouTube videos. I’ve been doing a lot of thinking about the idea of “the quotidian web”, learning from the bottom half of the long tail of user-generated media so we can understand what most creators are doing with these tools, not just from the most successful influencers. But I’m going to limit myself to the question that started this blog post: how big is YouTube?
![]()
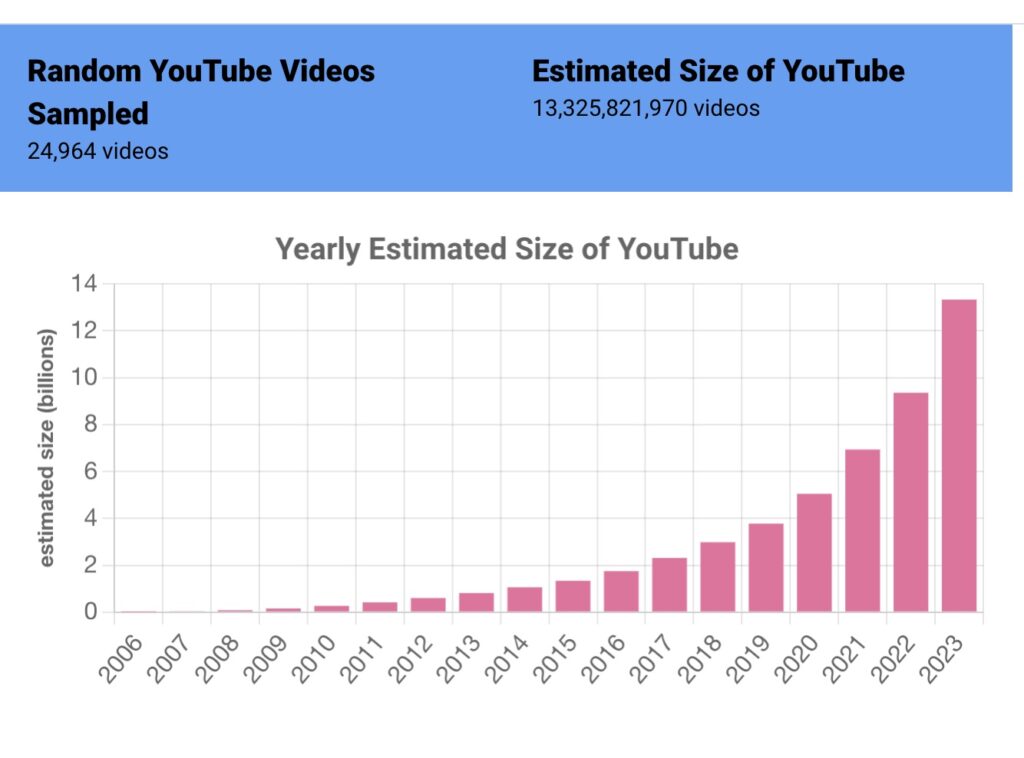
Consider drunk dialing again. Let’s assume you only dial numbers in the 413 area code: 413-000-0000 through 413-999-9999. That’s 10,000,000 possible numbers. If one in 100 phone calls connect, you can estimate that 100,000 people have numbers in the 413 area code. In our case, our drunk dials tried roughly 32k numbers at the same time, and we got a “hit” every 50,000 times or so. Our current estimate for the size of YouTube is 13.325 billion videos – we are now updating this number every few weeks at tubestats.org.
Once you’re collecting these random videos, other statistics are easy to calculate. We can look at how old our random videos are and calculate how fast YouTube is growing: we estimate that over 4 billion videos were posted to YouTube just in 2023. We can calculate the mean and median views per video, and show just how long the “long tail” is – videos with 10,000 or more views are roughly 4% of our data set, though they represent the lion’s share of views of the YouTube platform.
Perhaps the most important thing we did with our set of random videos is to demonstrate a vastly better way of studying YouTube than drunk dialing. We know our method is random because it iterates through the entire possible address space. By comparing our results to other ways of generating lists of YouTube videos, we can declare them “plausibly random” if they generate similar results. Fortunately, one method does – it was discovered by Jia Zhou et. al. in 2011, and it’s far more efficient than our naïve method. (You generate a five character string where one character is a dash – YouTube will autocomplete those URLs and spit out a matching video if one exists.) Kevin now polls YouTube using the “dash method” and uses the results to maintain our dashboard at Tubestats.
We have lots more research coming out from this data set, both about what we’re discovering and about some complex ethical questions about how to handle this data. (Most of the videos we’re discovering were only seen by a few dozen people. If we publish those URLs, we run the risk of exposing to public scrutiny videos that are “public” but whose authors could reasonably expect obscurity. Thus our paper does not include the list of videos discovered.) Ryan has a great introduction to main takeaways from our hand-coding. He and I are both working on longer writing about the weird world of random videos – what can we learn from spending time deep in the long tail?
Perhaps most importantly, we plan to maintain Tubestats so long as we can. It’s possible that YouTube will object to the existence of this resource or the methods we used to create it. Counterpoint: I believe that high level data like this should be published regularly for all large user-generated media platforms. These platforms are some of the most important parts of our digital public sphere, and we need far more information about what’s on them, who creates this content and who it reaches.
Many thanks to the Journal for Quantitative Description of publishing such a large and unwieldy paper – it’s 85 pages! Thanks and congratulations to all authors: Ryan McGrady, Kevin Zheng, Rebecca Curran, Jason Baumgartner and myself. And thank you to everyone who’s funded our work: the Knight Foundation has been supporting a wide range of our work on studying extreme speech on social media, and other work in our lab is supported by the Ford Foundation and the MacArthur Foundation.
Finally – I’ve got COVID, so if this post is less coherent than normal, that’s to be expected. Feel free to use the comments to tell me what didn’t make sense and I will try to clear it up when my brain is less foggy.