Over the weekend starting on Saturday, the 8th of February 2025, the Baltic states’ electricity grid is switching from being synchronized with the Russian electric grid to being synchronized with the continental European electrical grid. This involves first disconnecting from the Russian grid, then operating a while as an island system, regulating the frequency alone and doing various tests, and finally, synchronizing frequency and phase with the EU grid and throwing the breaker. Which made me wonder earlier today: How hard would it be to watch the frequency changing?
The proper way to do this would probably be to step down line voltage to something more manageable and then just record that signal directly and find the dominant frequency component in that. However, I don’t have a step-down converter, or really any electrical equipment, and I am a mains voltage respecter and not about to plug anything homemade into a socket. So that’s out. However, there’s an easier way: Fortunately, just about everything is an antenna.
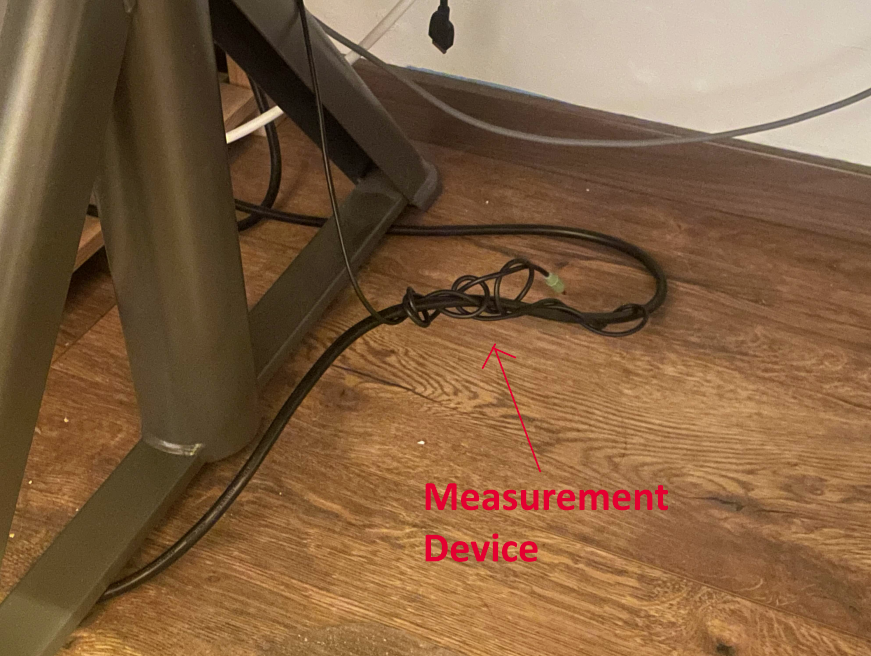
I did my PhD in biosignals processing, and a common problem there is to get mains hum out of just about every signal. If you don’t take great care and employ technical measures to get rid of it, you will get substantial 50Hz hum in your signals. Even if you do, there’s likely to still be some. While this is more of a problem with the high amplification factors required to record, say, an EEG, it should still be true when just recording any signal. So, lets plug an audio cable into the PCs line in, wrap it around a power cable a few times for good measure, plug the other side into absolutely nothing, and see what we can do.
Firing up Audacity and just recording for a few seconds shows… a flat line with absolutely no audio.
But what if we normalize this apparent lack of a signal up to -3dBFS?
Ah! There’s a very noisy sine, and clearly, it’s somewhere around 50Hz. So this could work! Time to write some python.
Most of the script is boilerplate “record audio and put it into a ringbuffer” stuff, the more interesting part is a bit of basic DSP:
1 2 3 4 5 6 7 8 9 10 11 12 13 14 15 16 17 18 19 20 21 22 23 24 25 26 27 28 29 30 31 32 33 | |
I chose a relatively large FFT size (25 seconds) to have good frequency resolution - we can make up for that by just using a very low sample rate, since the frequencies we care about are very low as well, anyways. And indeed:
So how well does this work? How can we figure out if that reading is accurate? Fortunately, some people from Sympower, a power market company with offices in Estonia recently built their own, somewhat less hacky frequency monitoring tool, and it has a convenient API that lets you retrieve their data over some period of time. Turns out this works way better than it has any right to:
There is obviously some time lag, and the output is way more smoothed than the more proper measurement, but it clearly works quite well and measures broadly the correct thing!
The logger is now running on my computer collecting data, I want to see if I can tell from the logs I am writing when they flip the breaker and connect to the EU network, so I’ll keep it running over the weekend. If you want to try yourself, The full python script is here.
Update late on the 9th of February, 2025: @[email protected] pointed me to https://f50hz.de, which has an an API to get the european network frequency, so plotting my measurements next to that (shifting by 12.5 seconds to account for the time lag due to the very long Fourier transform window) gets us this, with the time axis in UTC:
You can perfectly see the moment the two networks are synced up. Right before, one shifts up in frequency and then goes down, while the other shifts down and then goes up - I wonder if this was intentional, it certainly looks a bit like it, letting the frequencies drift towards each other in a nice, controlled way before flipping the breaker.


