VTE (Virtual TErminal library) is the library underpinning various GNOME terminal emulators. It provides a GTK widget that shows a terminal view, which is used in apps like GNOME Terminal, Console, Black Box, Tilix, Terminator, Ptyxis, and others. It also powers embedded terminals in Builder and Workbench.
Over the GNOME 46 cycle, VTE has seen a lot of performance improvements. Christian Hergert mentioned some of them in his blog posts about VTE and about his work in GNOME 46. But how much did the performance actually improve? What should you, the user, expect to feel after installing a fresh Fedora 40 update and launching your favorite terminal?
Let’s measure and find out! If you don’t have time for measuring, you can skip straight to the finding out.
What Are We Measuring? #
There is no shortage of ways to define “performance”, especially when it comes to terminal emulators. One of the more tangible metrics is input latency. Roughly, it describes how quickly the program reacts to your actions: how much time passes from the moment you press a key on your keyboard to the change in color of the pixels on your monitor. Apps with low input latency feel snappy, whereas apps with high input latency can feel sluggish.
When the input latency is small-ish, you can get used to it and think it feels fine. However, comparing lower and higher input latency together (for example, by switching between two apps and typing in both) can make it quite noticeable. If you’ve ever heard people say they can’t go back to a 60 Hz monitor after trying out 144 Hz, that’s a similar effect (and input latency is partially responsible).
So, how do you measure it?
Measuring Input Latency #
There are tools like Typometer that measure the input latency in software by detecting key press events and recording the screen to detect a change in pixel color. This can work reasonably well but requires fiddling with your setup to make sure you’re not accidentally introducing any biases. For example, a screen capture API may return the new pixel colors a few milliseconds before or after they are shown on the monitor, depending on the system setup, and you need to be aware of this when trying to measure something to a millisecond precision.
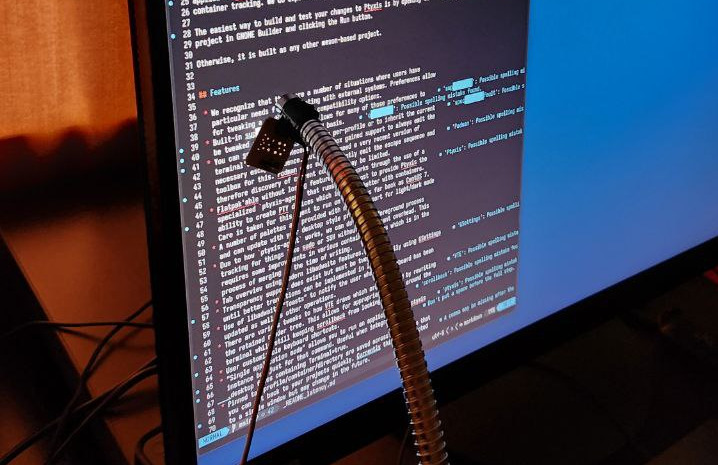
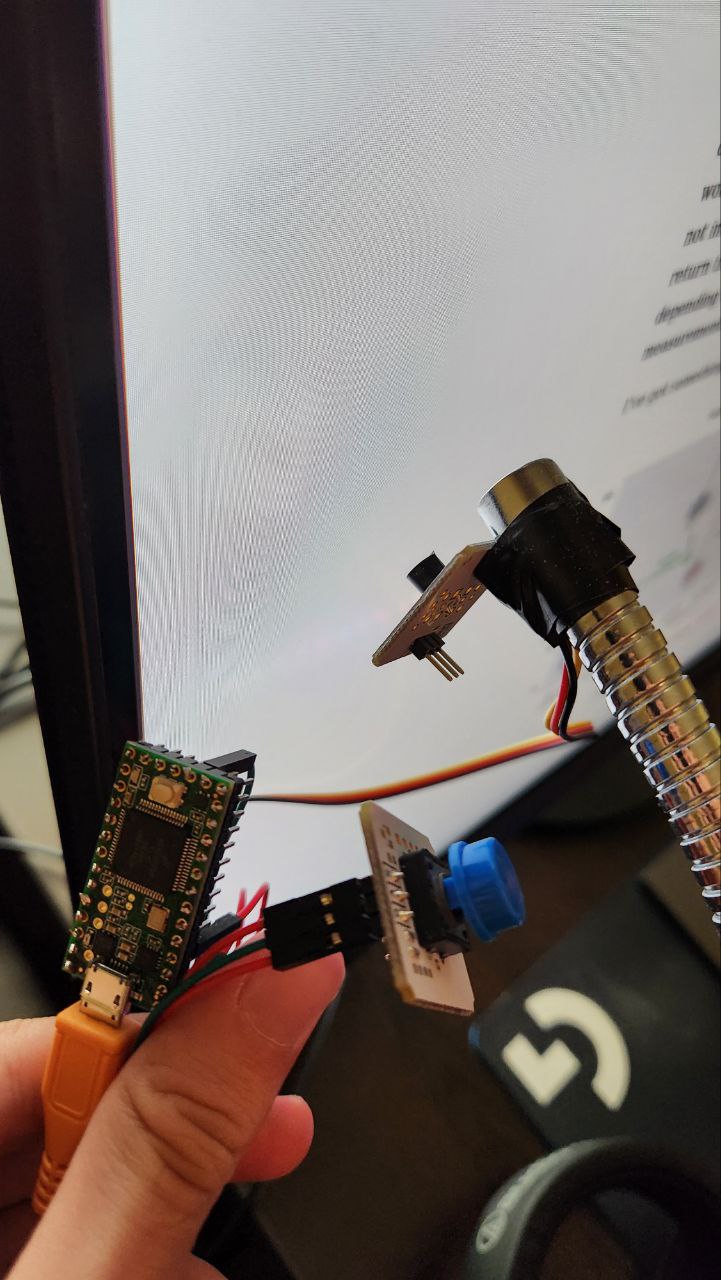
I’ve got something more interesting, a hardware input latency tester! It consists of a light sensor attached to a Teensy board, which in turn is plugged into the computer via USB.
I should really get around to writing a full blog post about this latency tester, but for now, you should read this post by Tristan Hume about building a similar device. I used that post as a reference for building mine, but I wrote my own firmware and analysis scripts (these I am not sharing until they are less of an utter mess).
The main benefit of such a device is that it allows you to measure a full end-to-end input latency, including processing time in the kernel, the compositor, the application, and then the response time of the monitor itself. You are measuring what you really see and feel, excluding only the keyboard firmware (since the latency tester sends key press events directly over USB). There’s also very little extra load on the system, especially compared to using something like a screen capture API.
Here’s a gist of how it works. The light sensor is aimed at a specific, small area on the monitor, which will be affected by the key press (in our case, a specific character cell in the terminal). The board sends a key press over USB (for example, Space) and starts monitoring the light sensor readings. As soon as it detects a jump in the light amount, it releases the key. Then, it presses a second key (for example, Backspace) and waits for the light to change back. Now we’re back to square one; the firmware waits a randomized amount (to prevent “snapping” to the monitor refresh rate) and repeats the experiment.
During all of this process, the board dumps light sensor readings over a serial port as fast as it can manage (I’m getting about 35,500 readings per second with my current board and firmware). On the computer, I save all of this data into a file for offline analysis with Python code. This analysis code finds the timestamp where the light starts to change, and subtracts it from the timestamp of the key press, to get one input latency measurement.
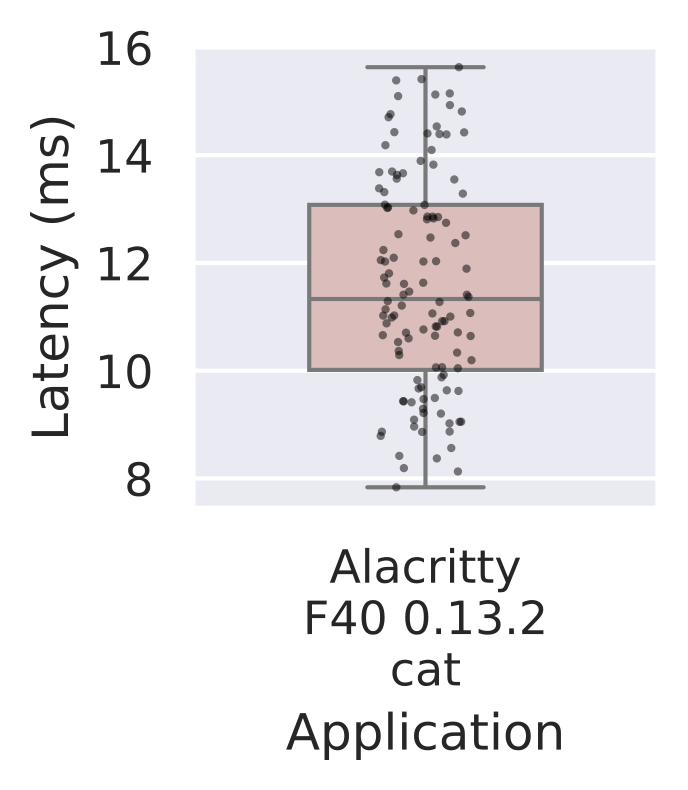
I then aggregate the measurements and plot them with seaborn. Here’s an example of what the result looks like:
Input Latency Plots #
Let’s explore what you can find on this latency plot.
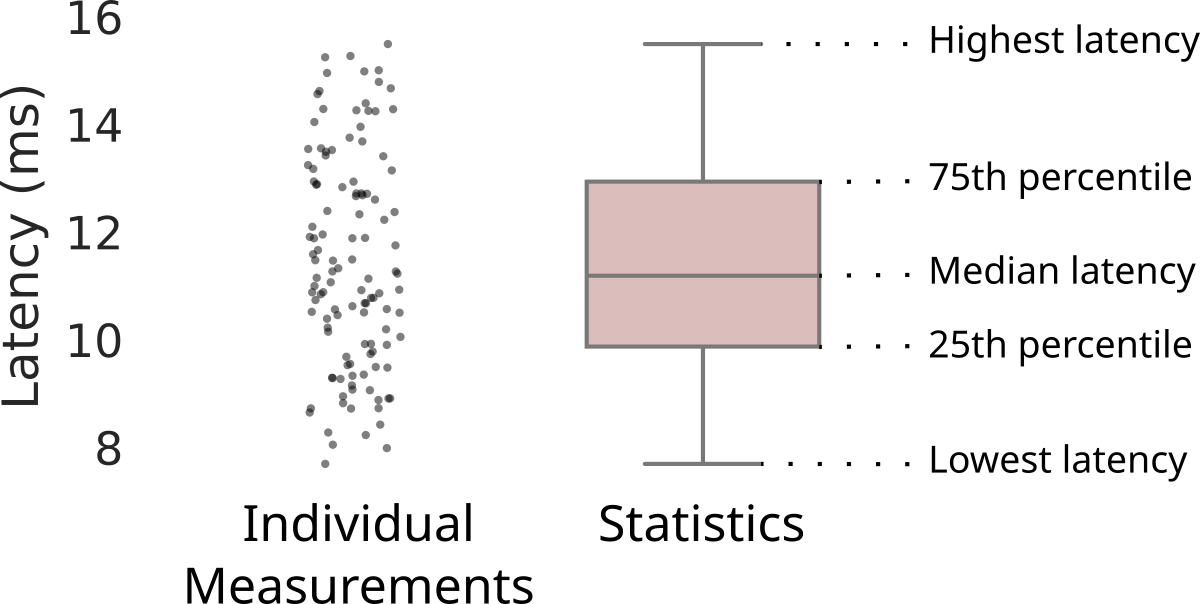
The small black dots represent the individual measurements. As in, every dot shows a real amount of time that had passed between one key press and the corresponding change in light on the sensor. There are 120 of these dots since I repeat each test 120 times.
Looking at the dots can confirm that the data is sensible. We expect the bulk of the measurements to be spread uniformly across an interval roughly the size of one monitor repaint cycle. This is because monitors generally repaint at a constant rate, and pressing a key at a random point in time should land us in a random point of the repaint cycle. We get the lowest latency if the application renders a new frame in response right in time for the monitor to show it. And we get the highest latency when the application finishes rendering a new frame just missing the monitor deadline, having to wait one extra repaint cycle for the pixel colors to change.
In the example above, the dots are spread over 7–8 ms, which is about equal to the ~6.94 ms refresh cycle of my 144 Hz monitor.
High outliers in the dots, or a larger spread, indicate lag or slowness of the application under test: some key presses are taking longer than others to process.
We do not expect to see any gaps between dot clusters. They would usually indicate aliasing with the monitor repaint cycle, or some frame scheduling bug in the compositor.
The box shows statistics over the individual measurements:
- median (a measurement perfectly “in the middle” with half of the measurements lower and half of the measurements higher),
- lowest and highest measurement,
- 25th and 75th percentiles (with 25% and 75% of the measurements lower than the line, respectively).
All in all, you can compare applications by their spread, then by the median latency, and also look if there are any outliers.
With all that said, we’re almost ready to look at some results. I just need to tell you what exactly I was measuring the latency of.
Test Setup #
I did all tests on this system:
- Lenovo Legion 7 Gen 7 AMD with Ryzen 7 6800H CPU and Radeon RX 6700M dGPU (using the dGPU exclusively via the MUX switch).
- Monitor: Acer Nitro XV320QU, 2560×1440, 144 Hz, using 100% scale.
- Host: Fedora 40 Silverblue Beta, Mesa 24.0.4.
- Compositor: raw Mutter 46.0.
What is raw Mutter, you may ask?
Well, Mutter is the compositor that GNOME Shell builds on top of.
Turns out, you can start Mutter on its own, without GNOME Shell, by switching to a different VT and running a command like mutter --display-server -- alacritty.
This gives you a very bare-bones environment that is only really meant for testing.
It is, however, quite useful for benchmarking, as it represents something close to a zero-overhead GNOME Shell ideal case.
I’m testing several terminal applications. In the order of appearance on the plots, they are:
- Alacritty: not VTE-based; serves as a baseline of sorts, because it is consistently one of the fastest terminals according to all of my prior tests.
- Console: GTK 4, the default terminal in GNOME.
- VTE Test App: GTK 4, a test terminal that lives in the VTE repository.
- GNOME Terminal: GTK 3, used to be the default in GNOME, and is still shipped out of the box in several distributions.
Since the intention is to compare GNOME 45 to GNOME 46, I used toolb\0x containers with Fedora 39 and Fedora 40 to install and run all terminals above, as packaged by Fedora with no extra tweaks.
I ran the terminals one by one and put their windows in the top left corner of the monitor. The mouse cursor was outside the window for all tests.
Input Latency Tests #
The first test is simple: I run cat > /dev/null to get an input field with no readline or similar processing, and then I measure how long it takes for the terminal to move its block cursor one cell to the right after pressing Space.
This is meant to test the best possible scenario for the terminal, with the least overhead.
This is what the test process looks like:
And here are the results:
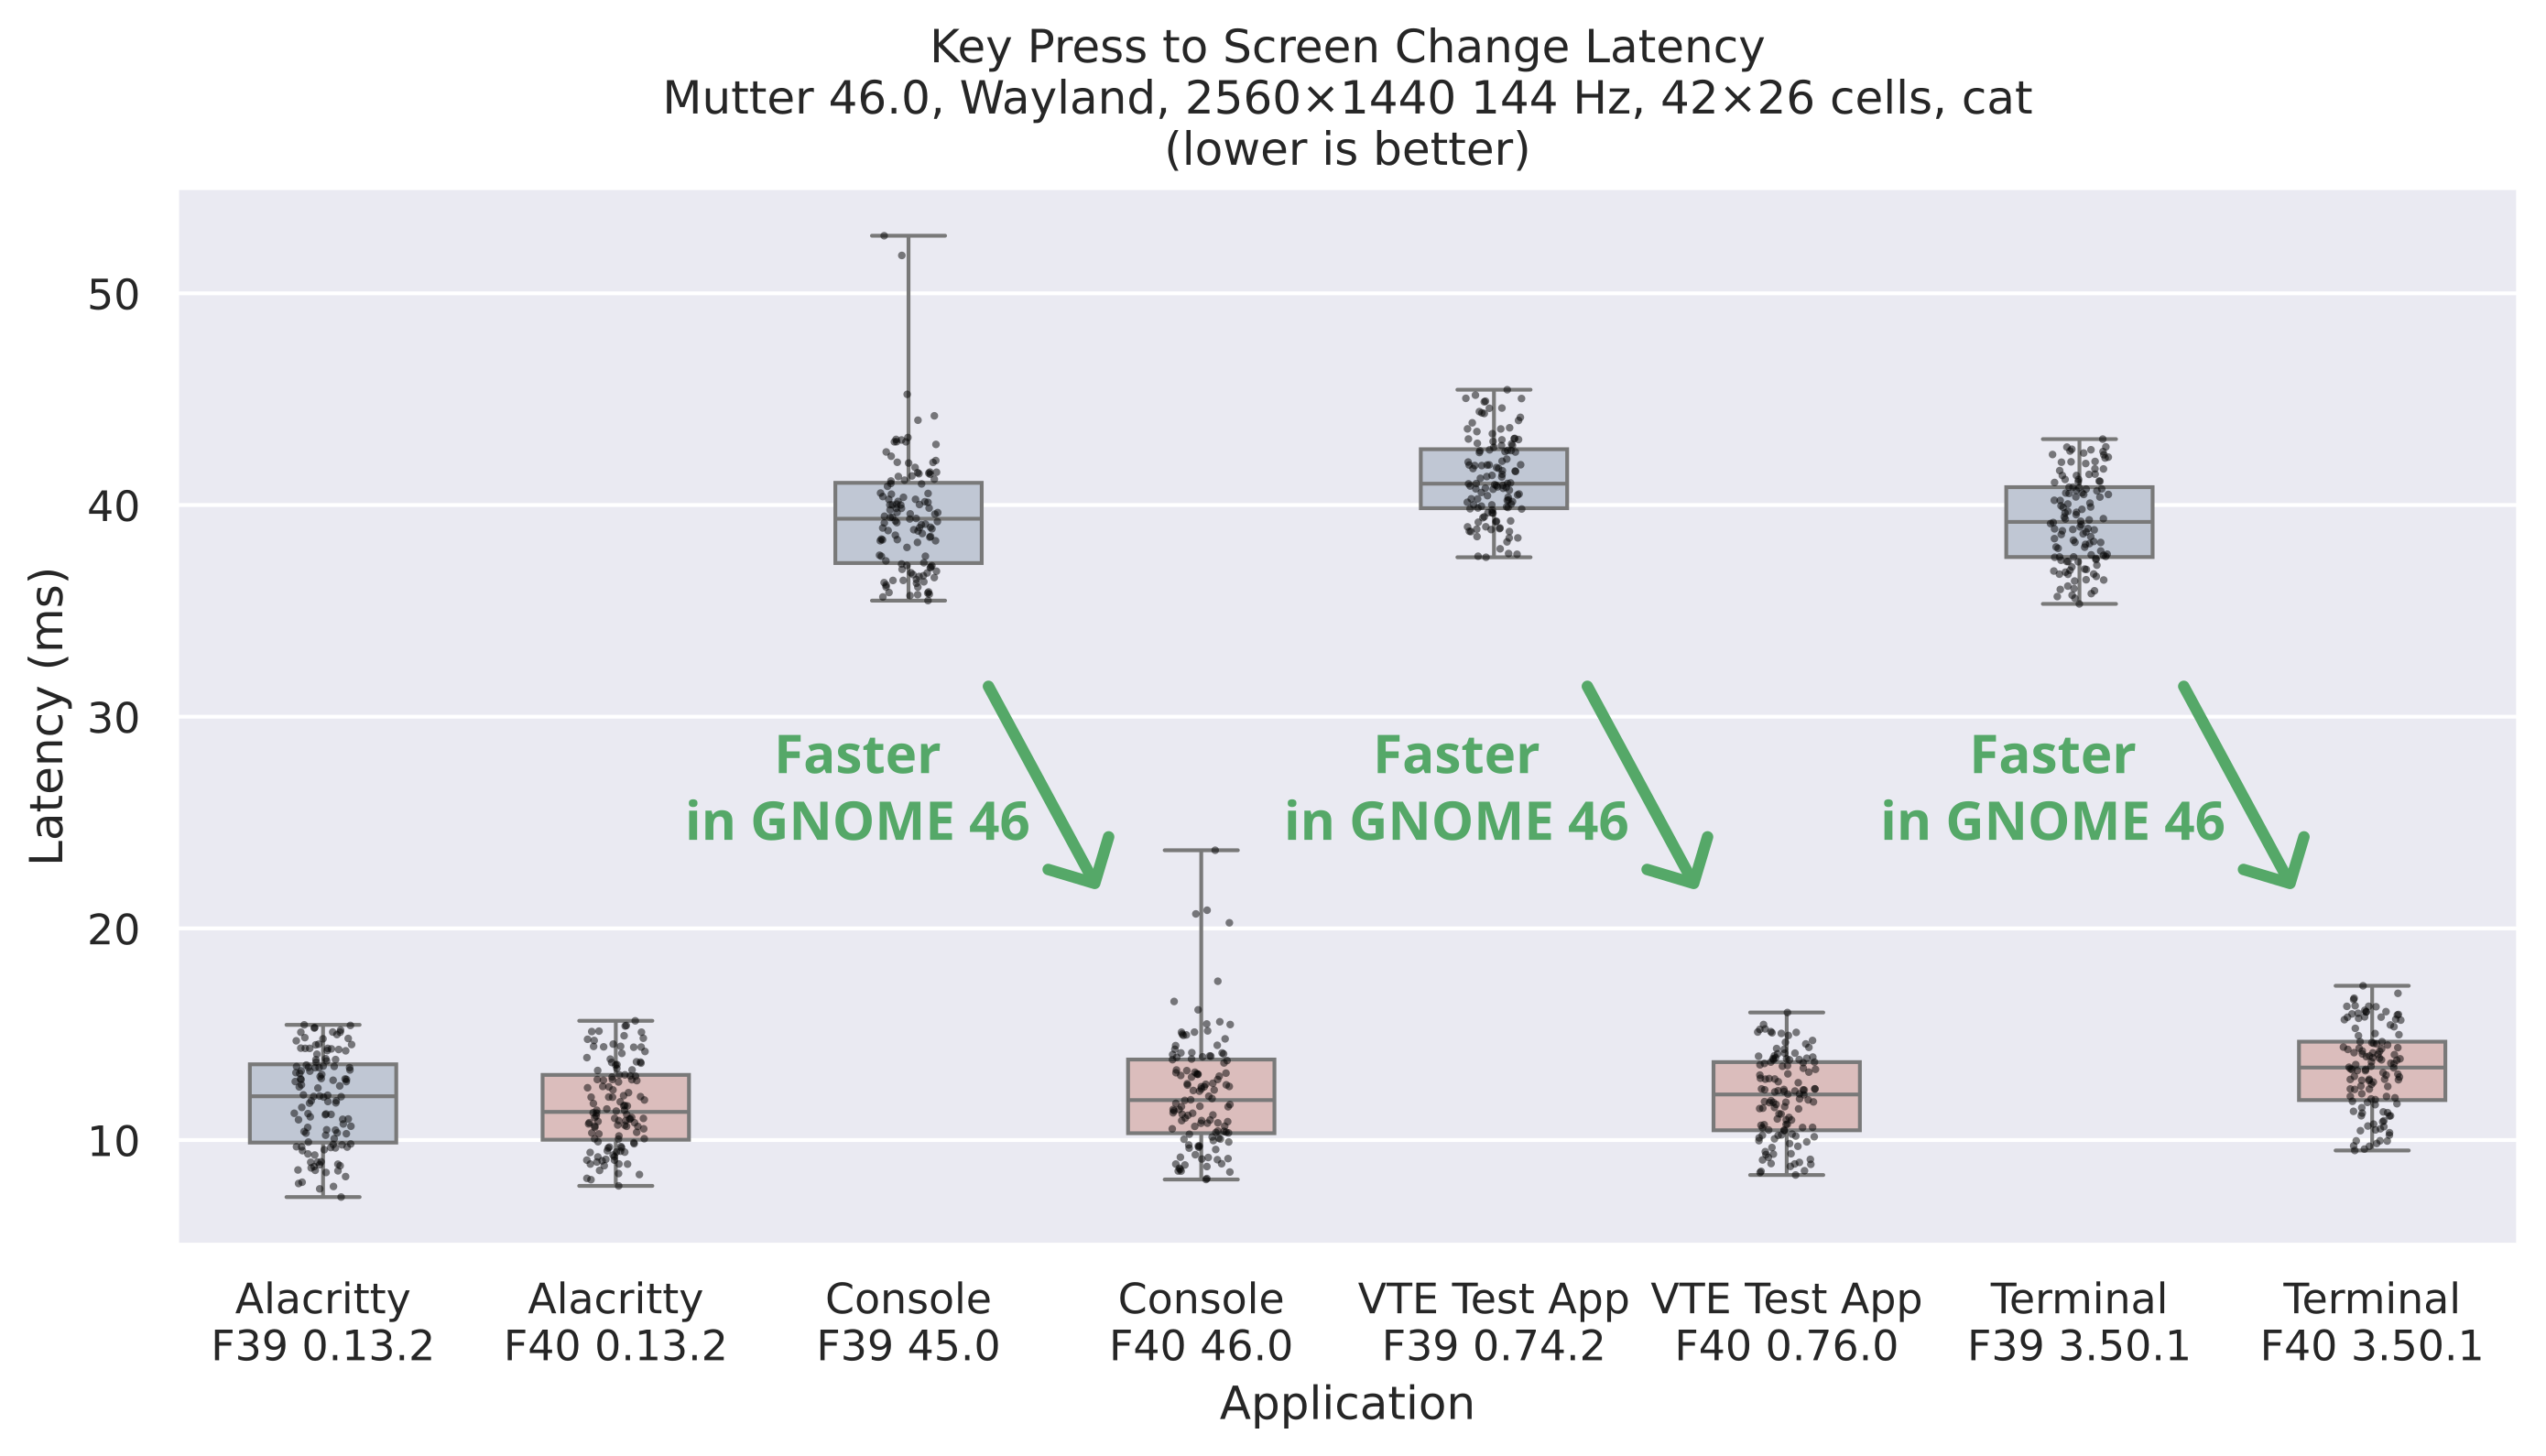
Alacritty, which is our baseline, did not change from F39 to F40, as expected.
But look at the massive improvement on all of the VTE terminals! They went from quite bad to pretty much on par with Alacritty, even the GTK 3 GNOME Terminal is very close.
The main change that caused this much improvement is likely this one by Christian that moves away from a 40 Hz VTE repaint timer to drawing every frame, synchronized with the monitor, as any self-respecting GTK widget should do.
Console has a few outliers which are maybe caused by its process tracking, but those are nothing new (they may be looked into for GNOME 47).
For the next test, I constructed a more realistic case. I took a snapshot of my neovim setup and opened the README from Ptyxis. I then strategically replaced a square of text with Unicode full-block characters to provide a bright “landing pad” for the light sensor.
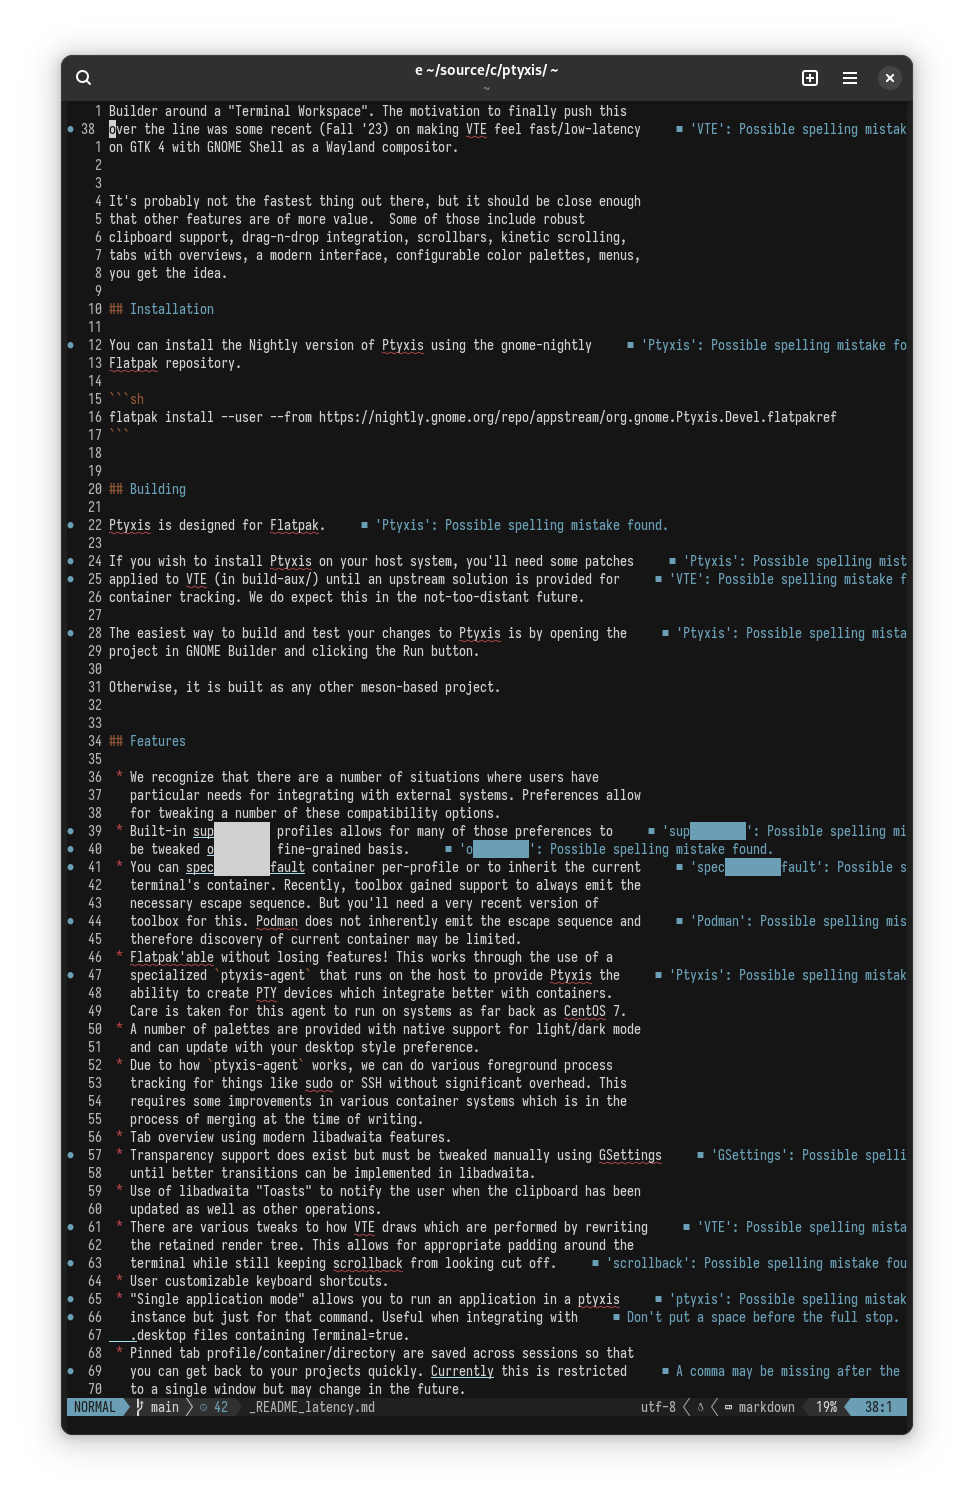
The test consists of repeatedly pressing Ctrl+D and Ctrl+U to scroll the text buffer down and up in neovim. The light sensor alternates between an empty line (dark) and the full-block landing pad (bright). The neovim setup has a bunch of bells and whistles, so the terminal gets to have fun drawing the various underlines, undercurls, gutter icons, and the statusline.
This is what the test process looks like:
Here are the results:
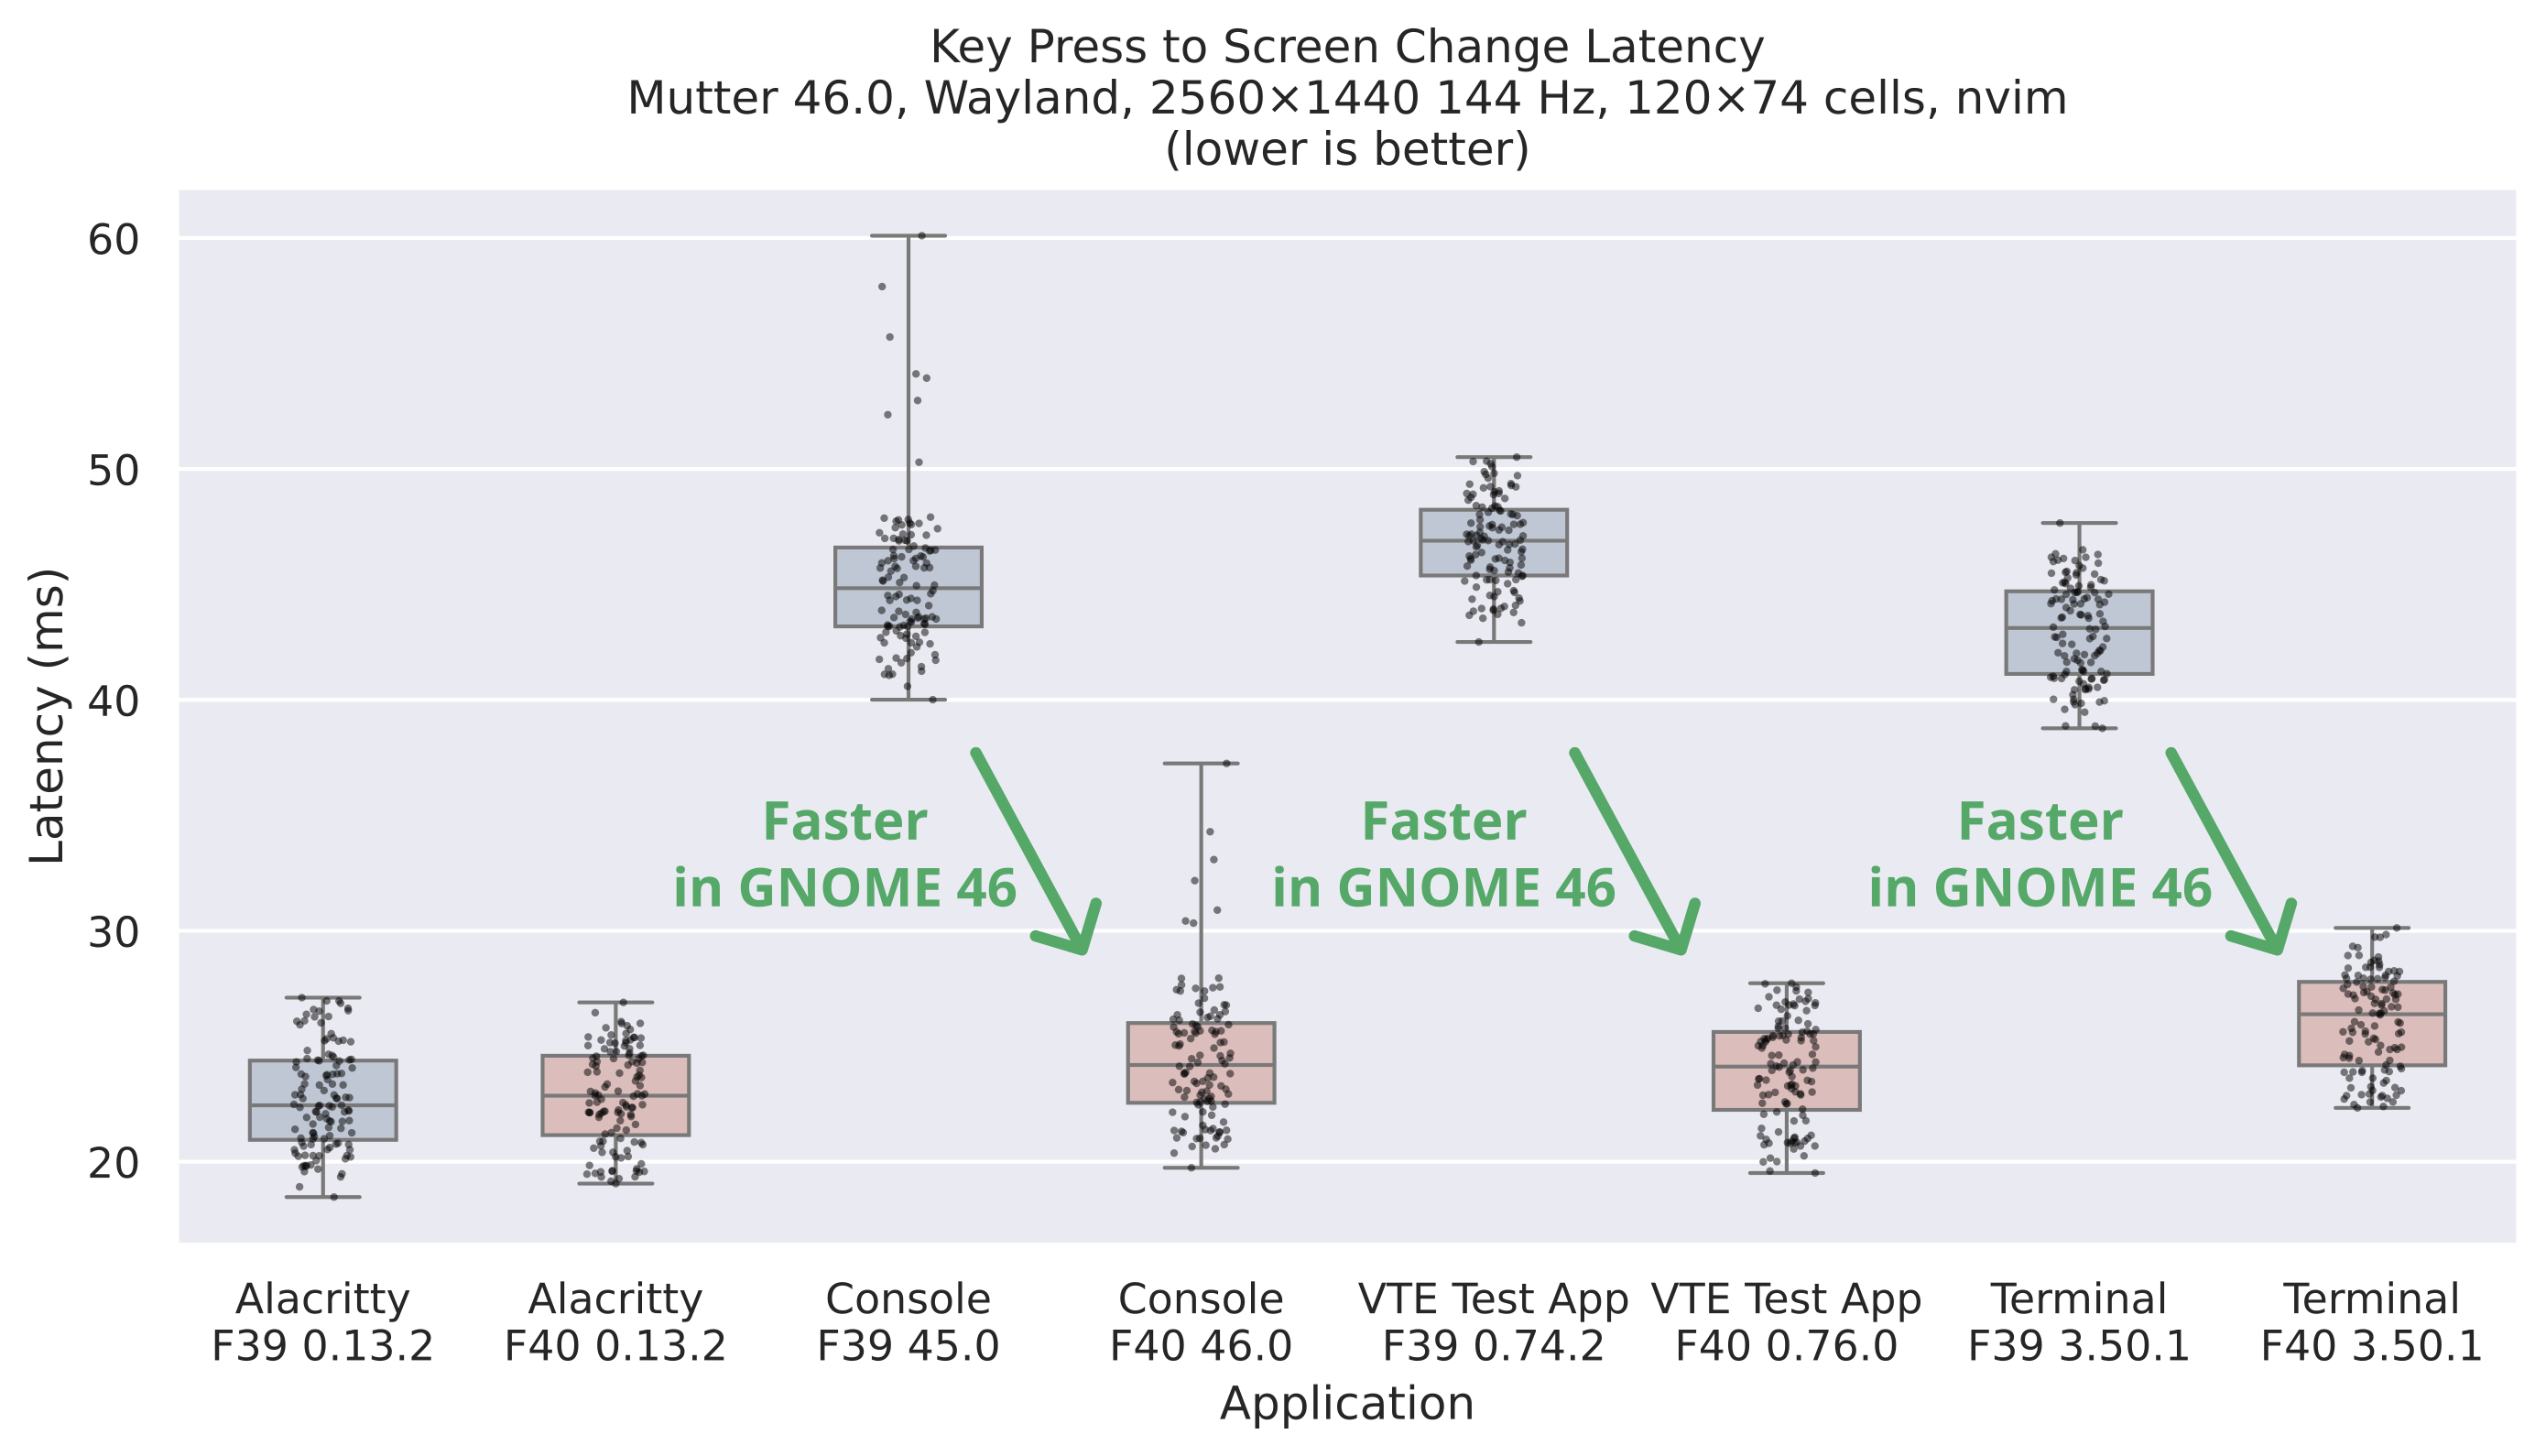
The massive improvement is clear on this test too, and our GNOME 46 terminals are still pretty much on par with Alacritty!
Finally, let’s take a closer look at all Fedora 40 results on one plot:
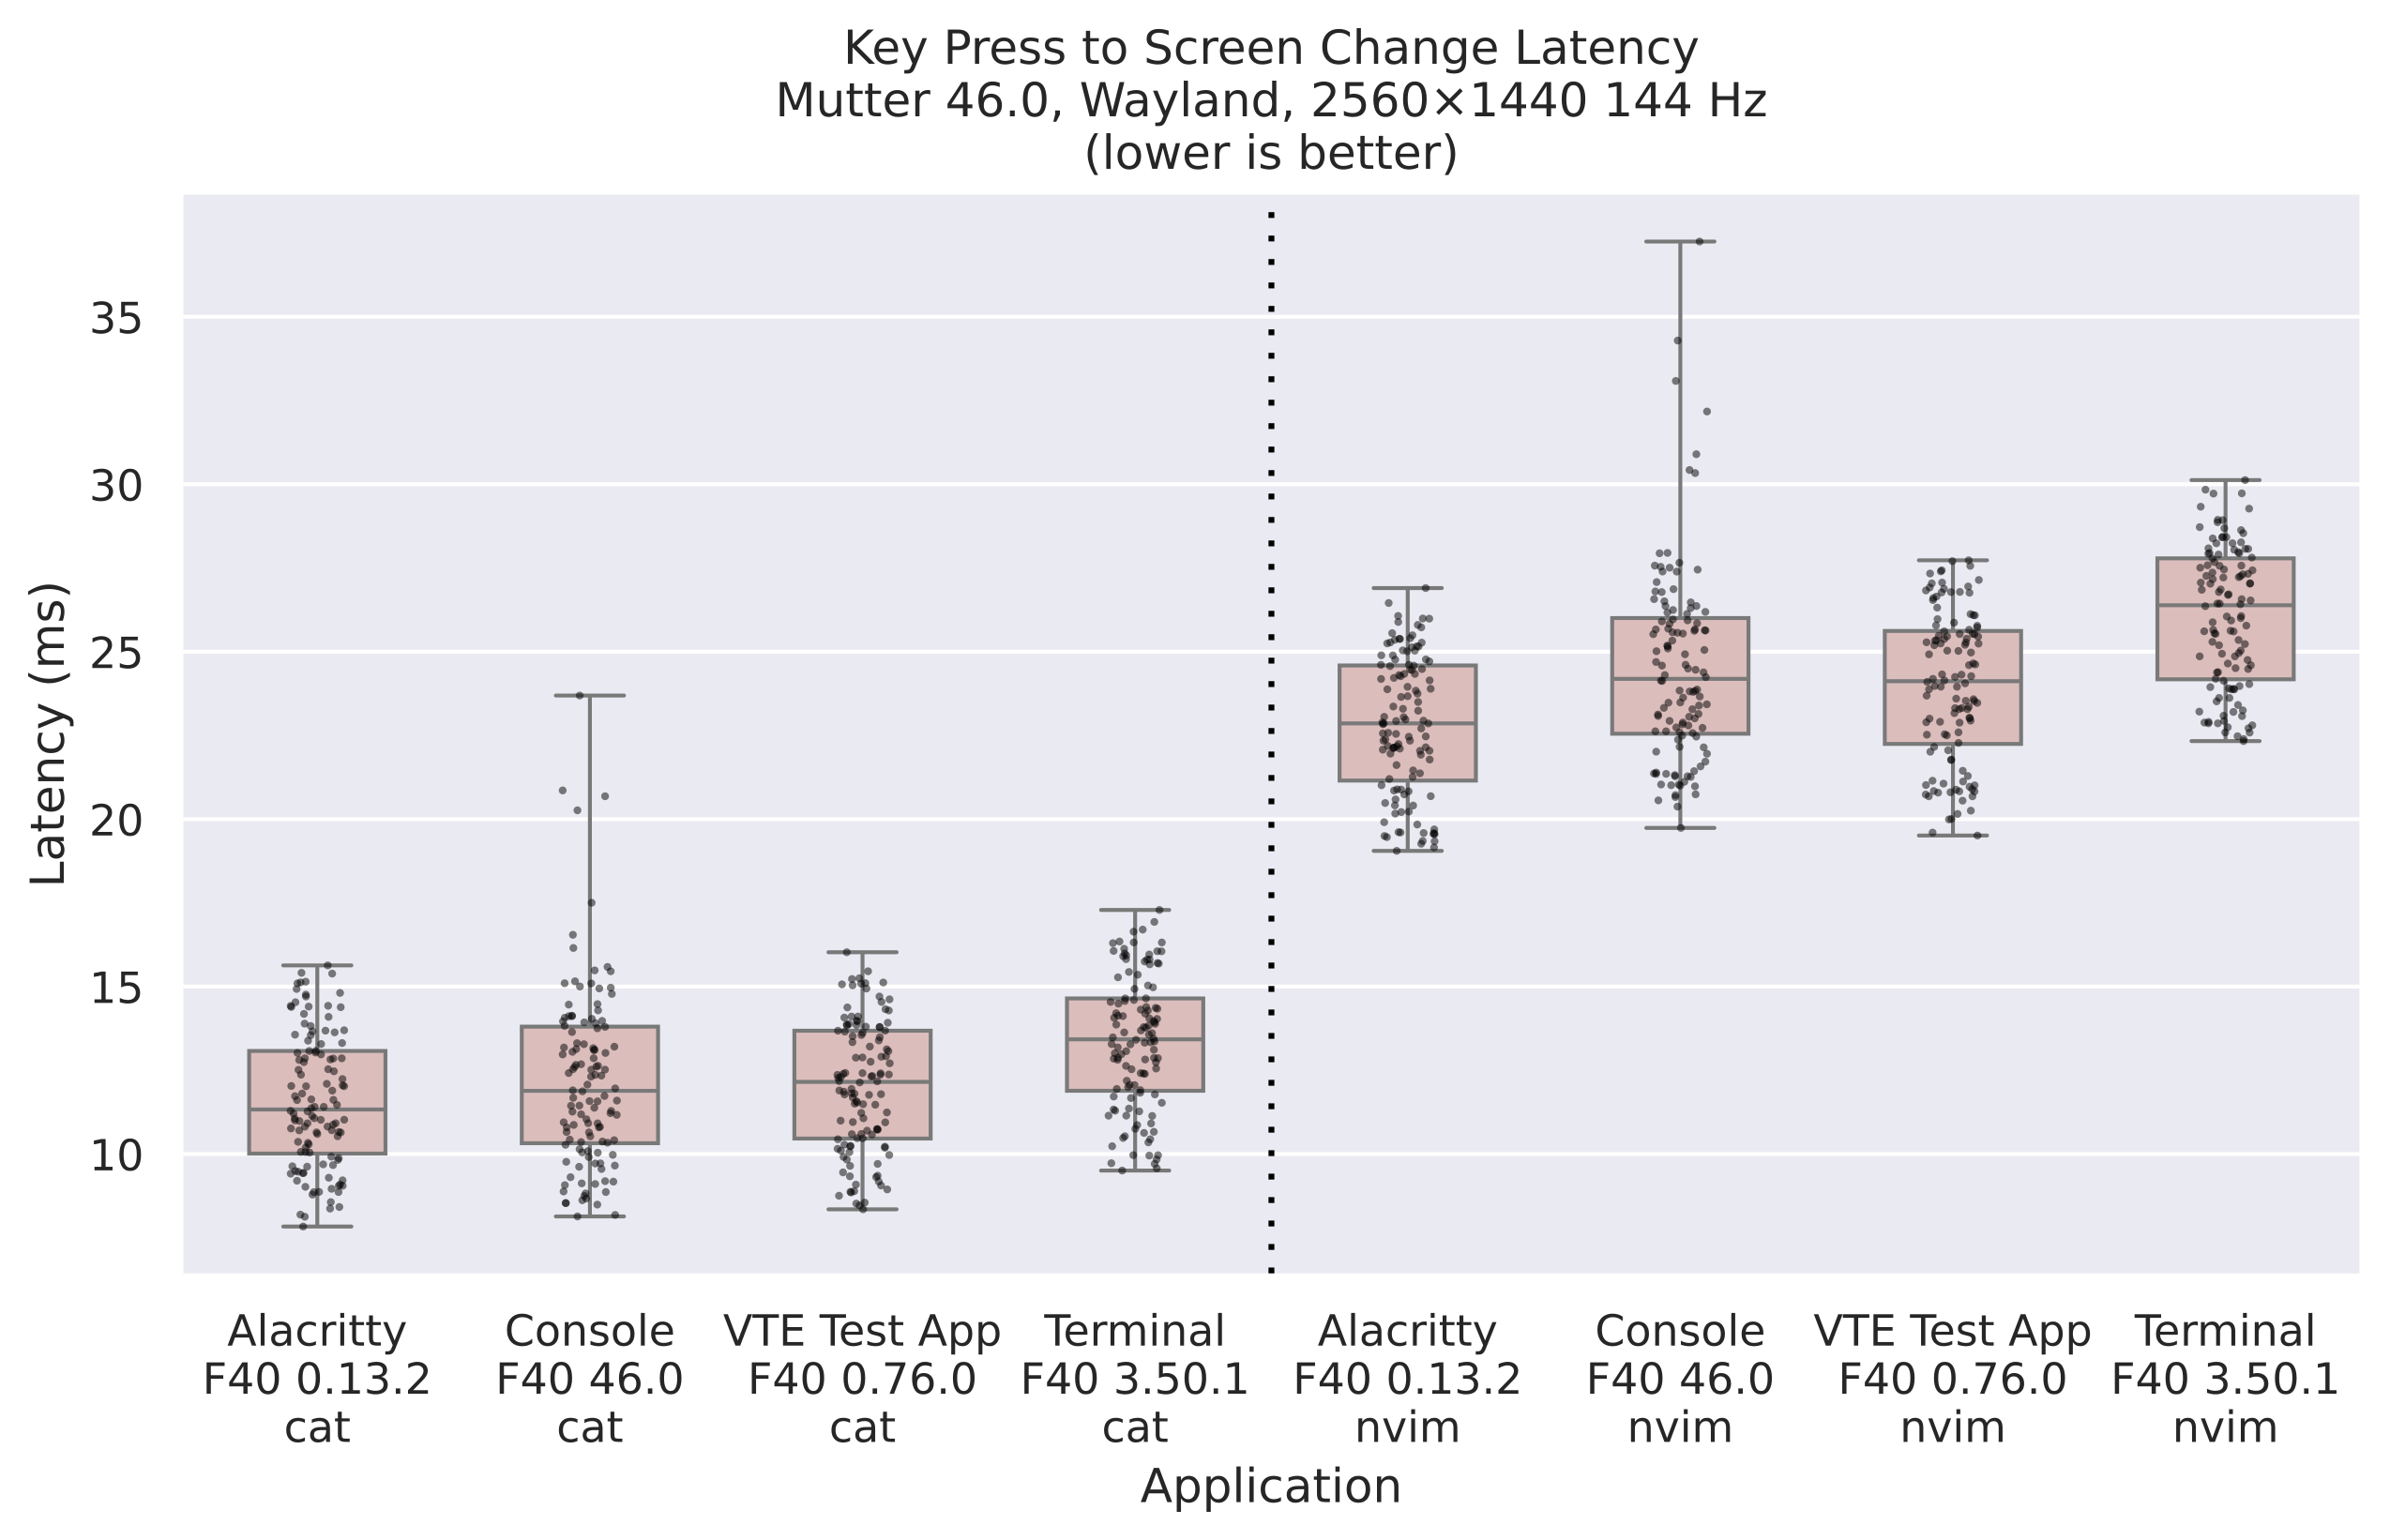
This plot shows how much of a latency toll the neovim test takes compared to a simple cat, but the latency increase is similar across all terminals.
vtebench #
I also ran Alacritty’s vtebench suite across the same set of applications and configurations.
This is a fully automated benchmark that measures something completely different from input latency: PTY read and parsing performance.
It has also proven quite capable at finding crashes in VTE.
Here’s what vtebench’s README has to say:
This benchmark is not sufficient to get a general understanding of the performance of a terminal emulator. It lacks support for critical factors like frame rate or latency. The only factor this benchmark stresses is the speed at which a terminal reads from the PTY. If you do not understand what this means, please do not jump to any conclusions from the results of this benchmark.
The repaint duration can and does affect the results of this test, especially for terminals that read and parse PTY on the same thread as they run their repaint logic, like VTE.
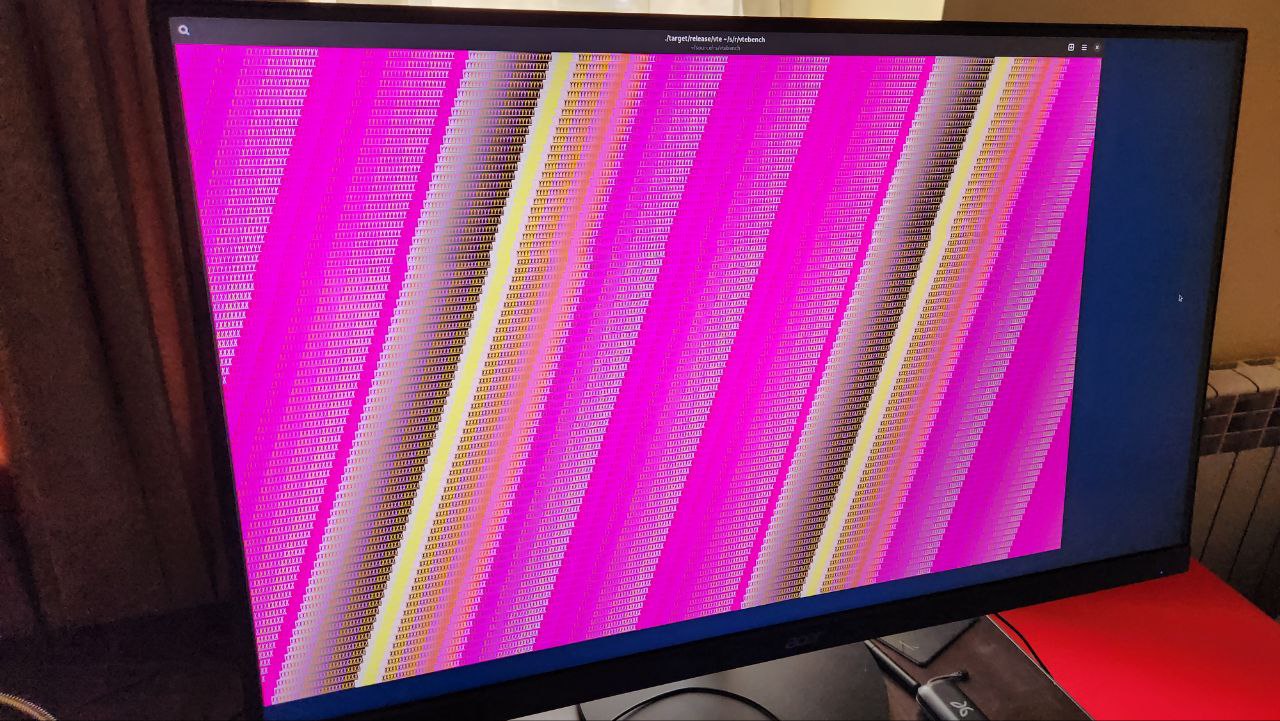
This is what one of the vtebench benchmarks looks like:
And here are the results:
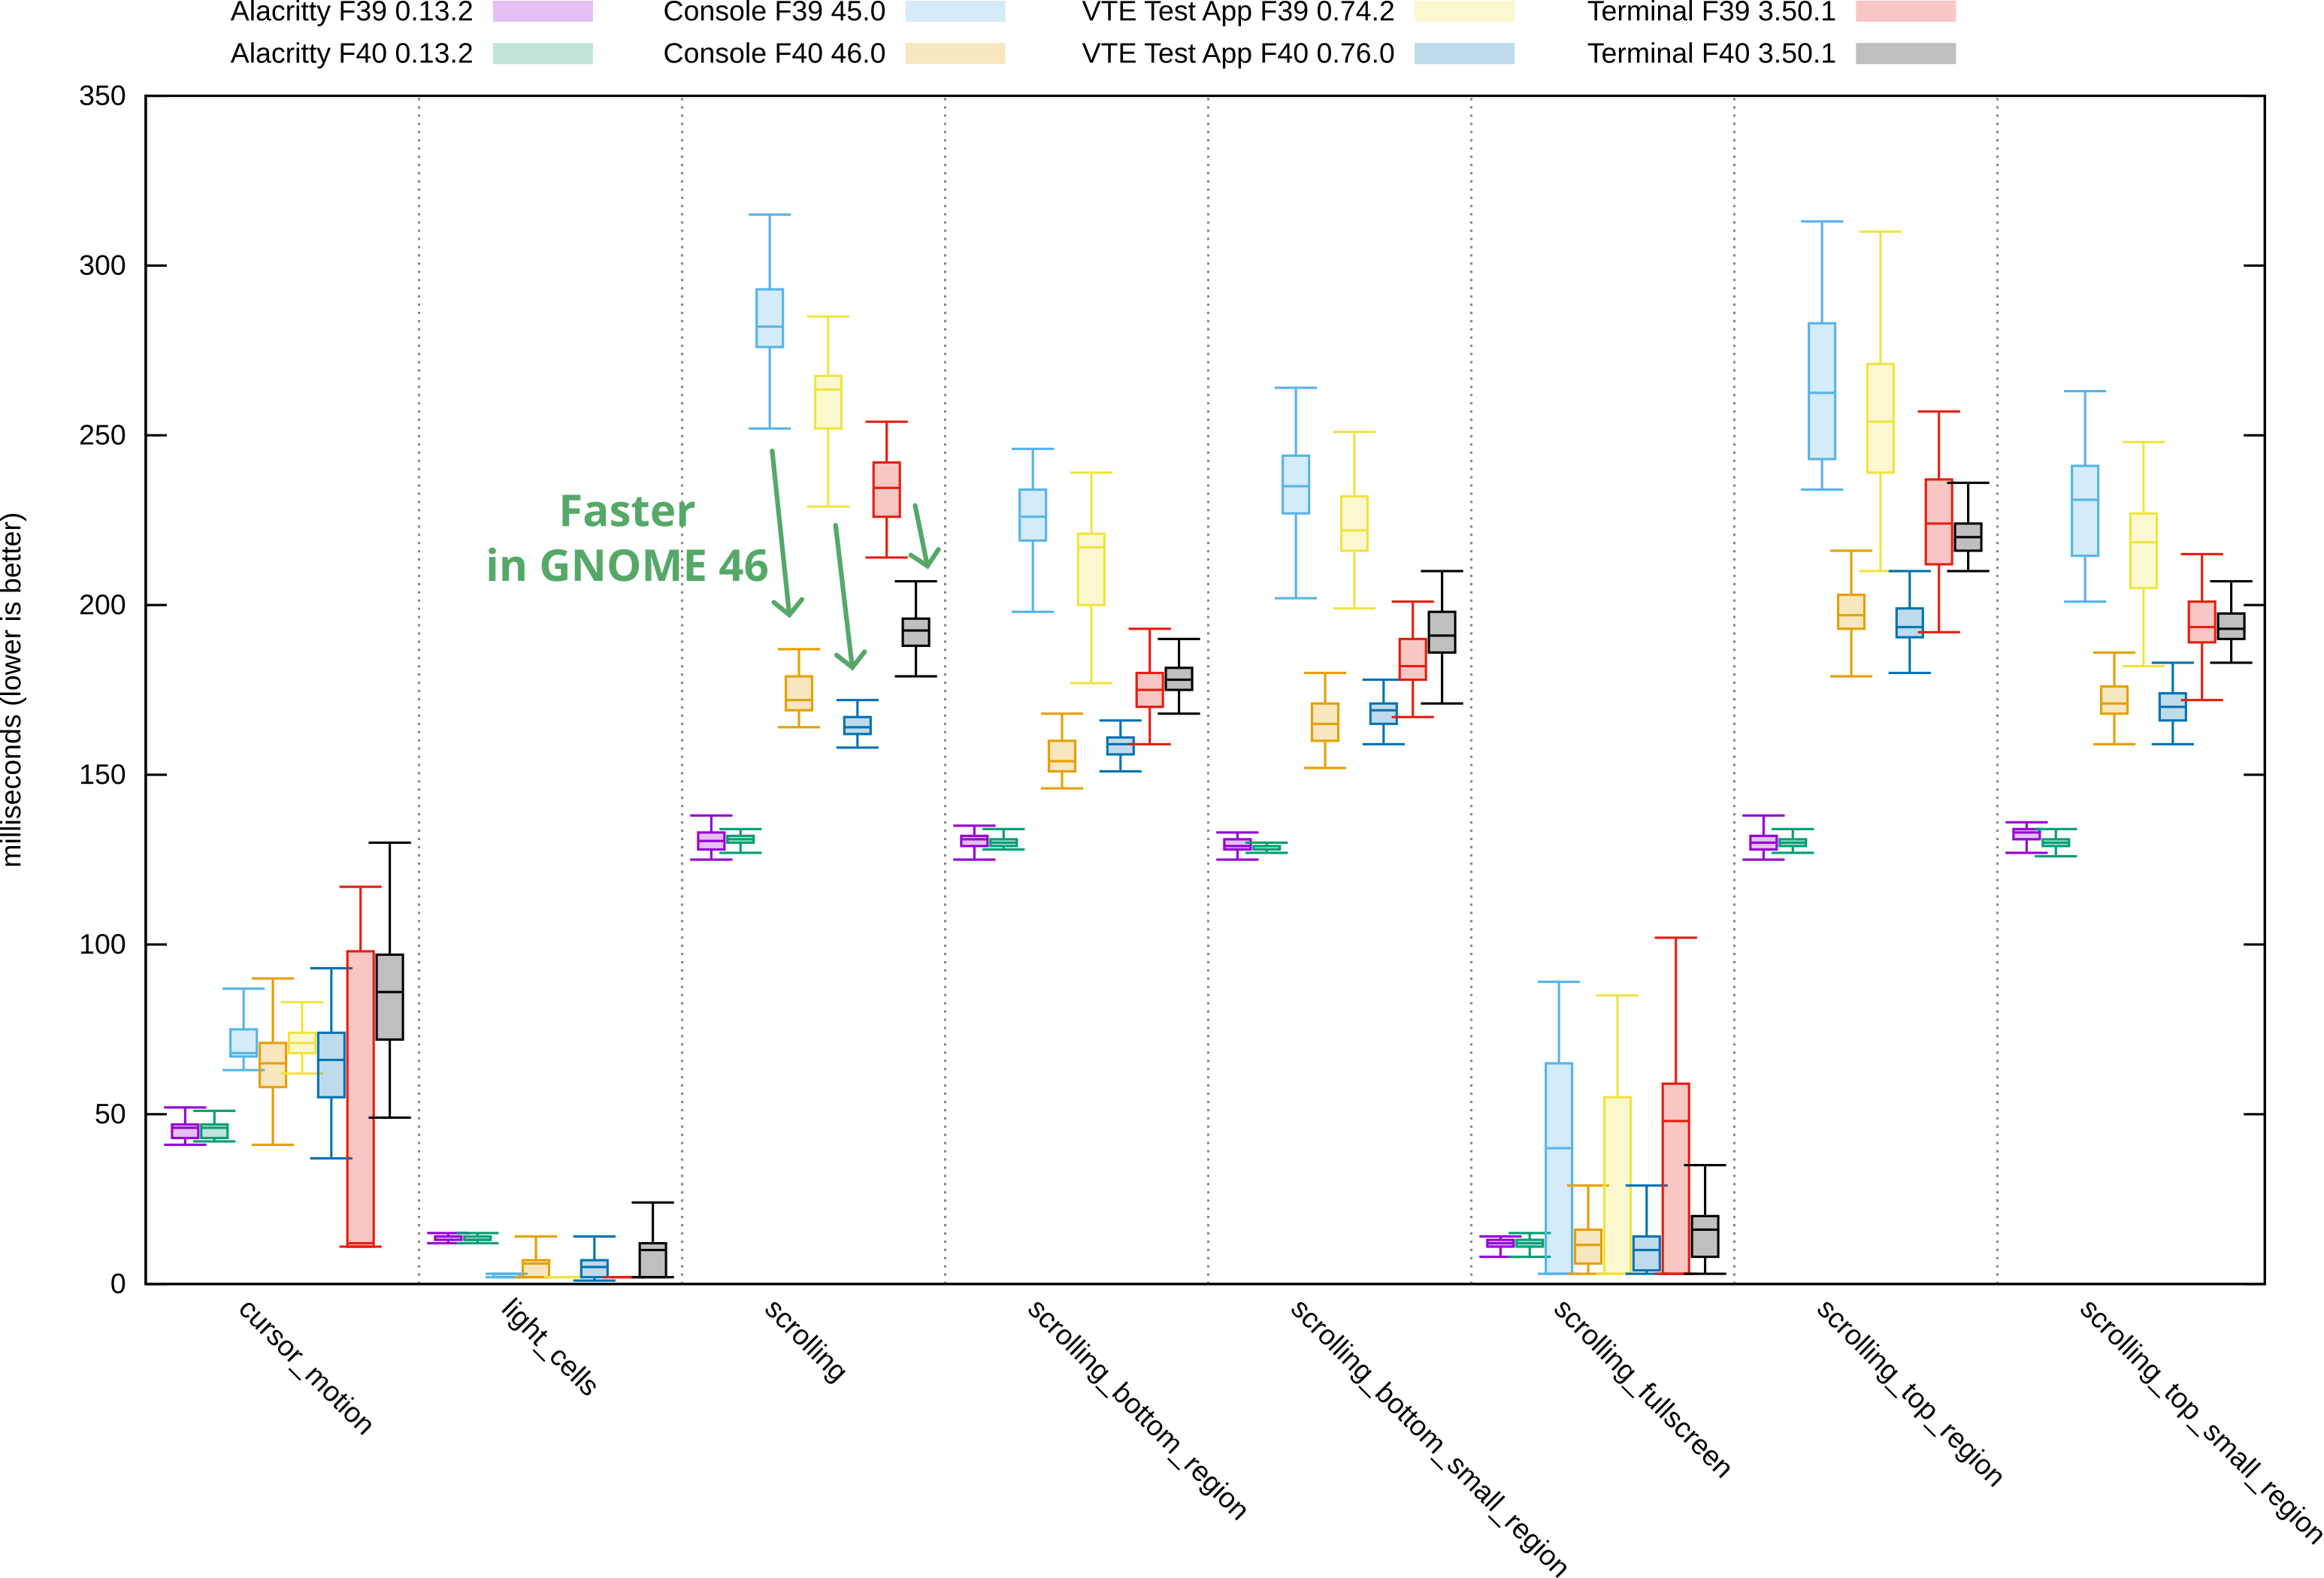
To avoid making this plot even busier, I drew the green arrows on only one of the benchmarks. As you can see, other benchmarks show a similar trend.
VTE from GNOME 46 shows some welcome improvements here too, although a lot more varied, and not quite on par with Alacritty (which renders in a separate thread from reading and parsing). These improvements likely come from the many other optimizations that happened in VTE during the GNOME 46 cycle.
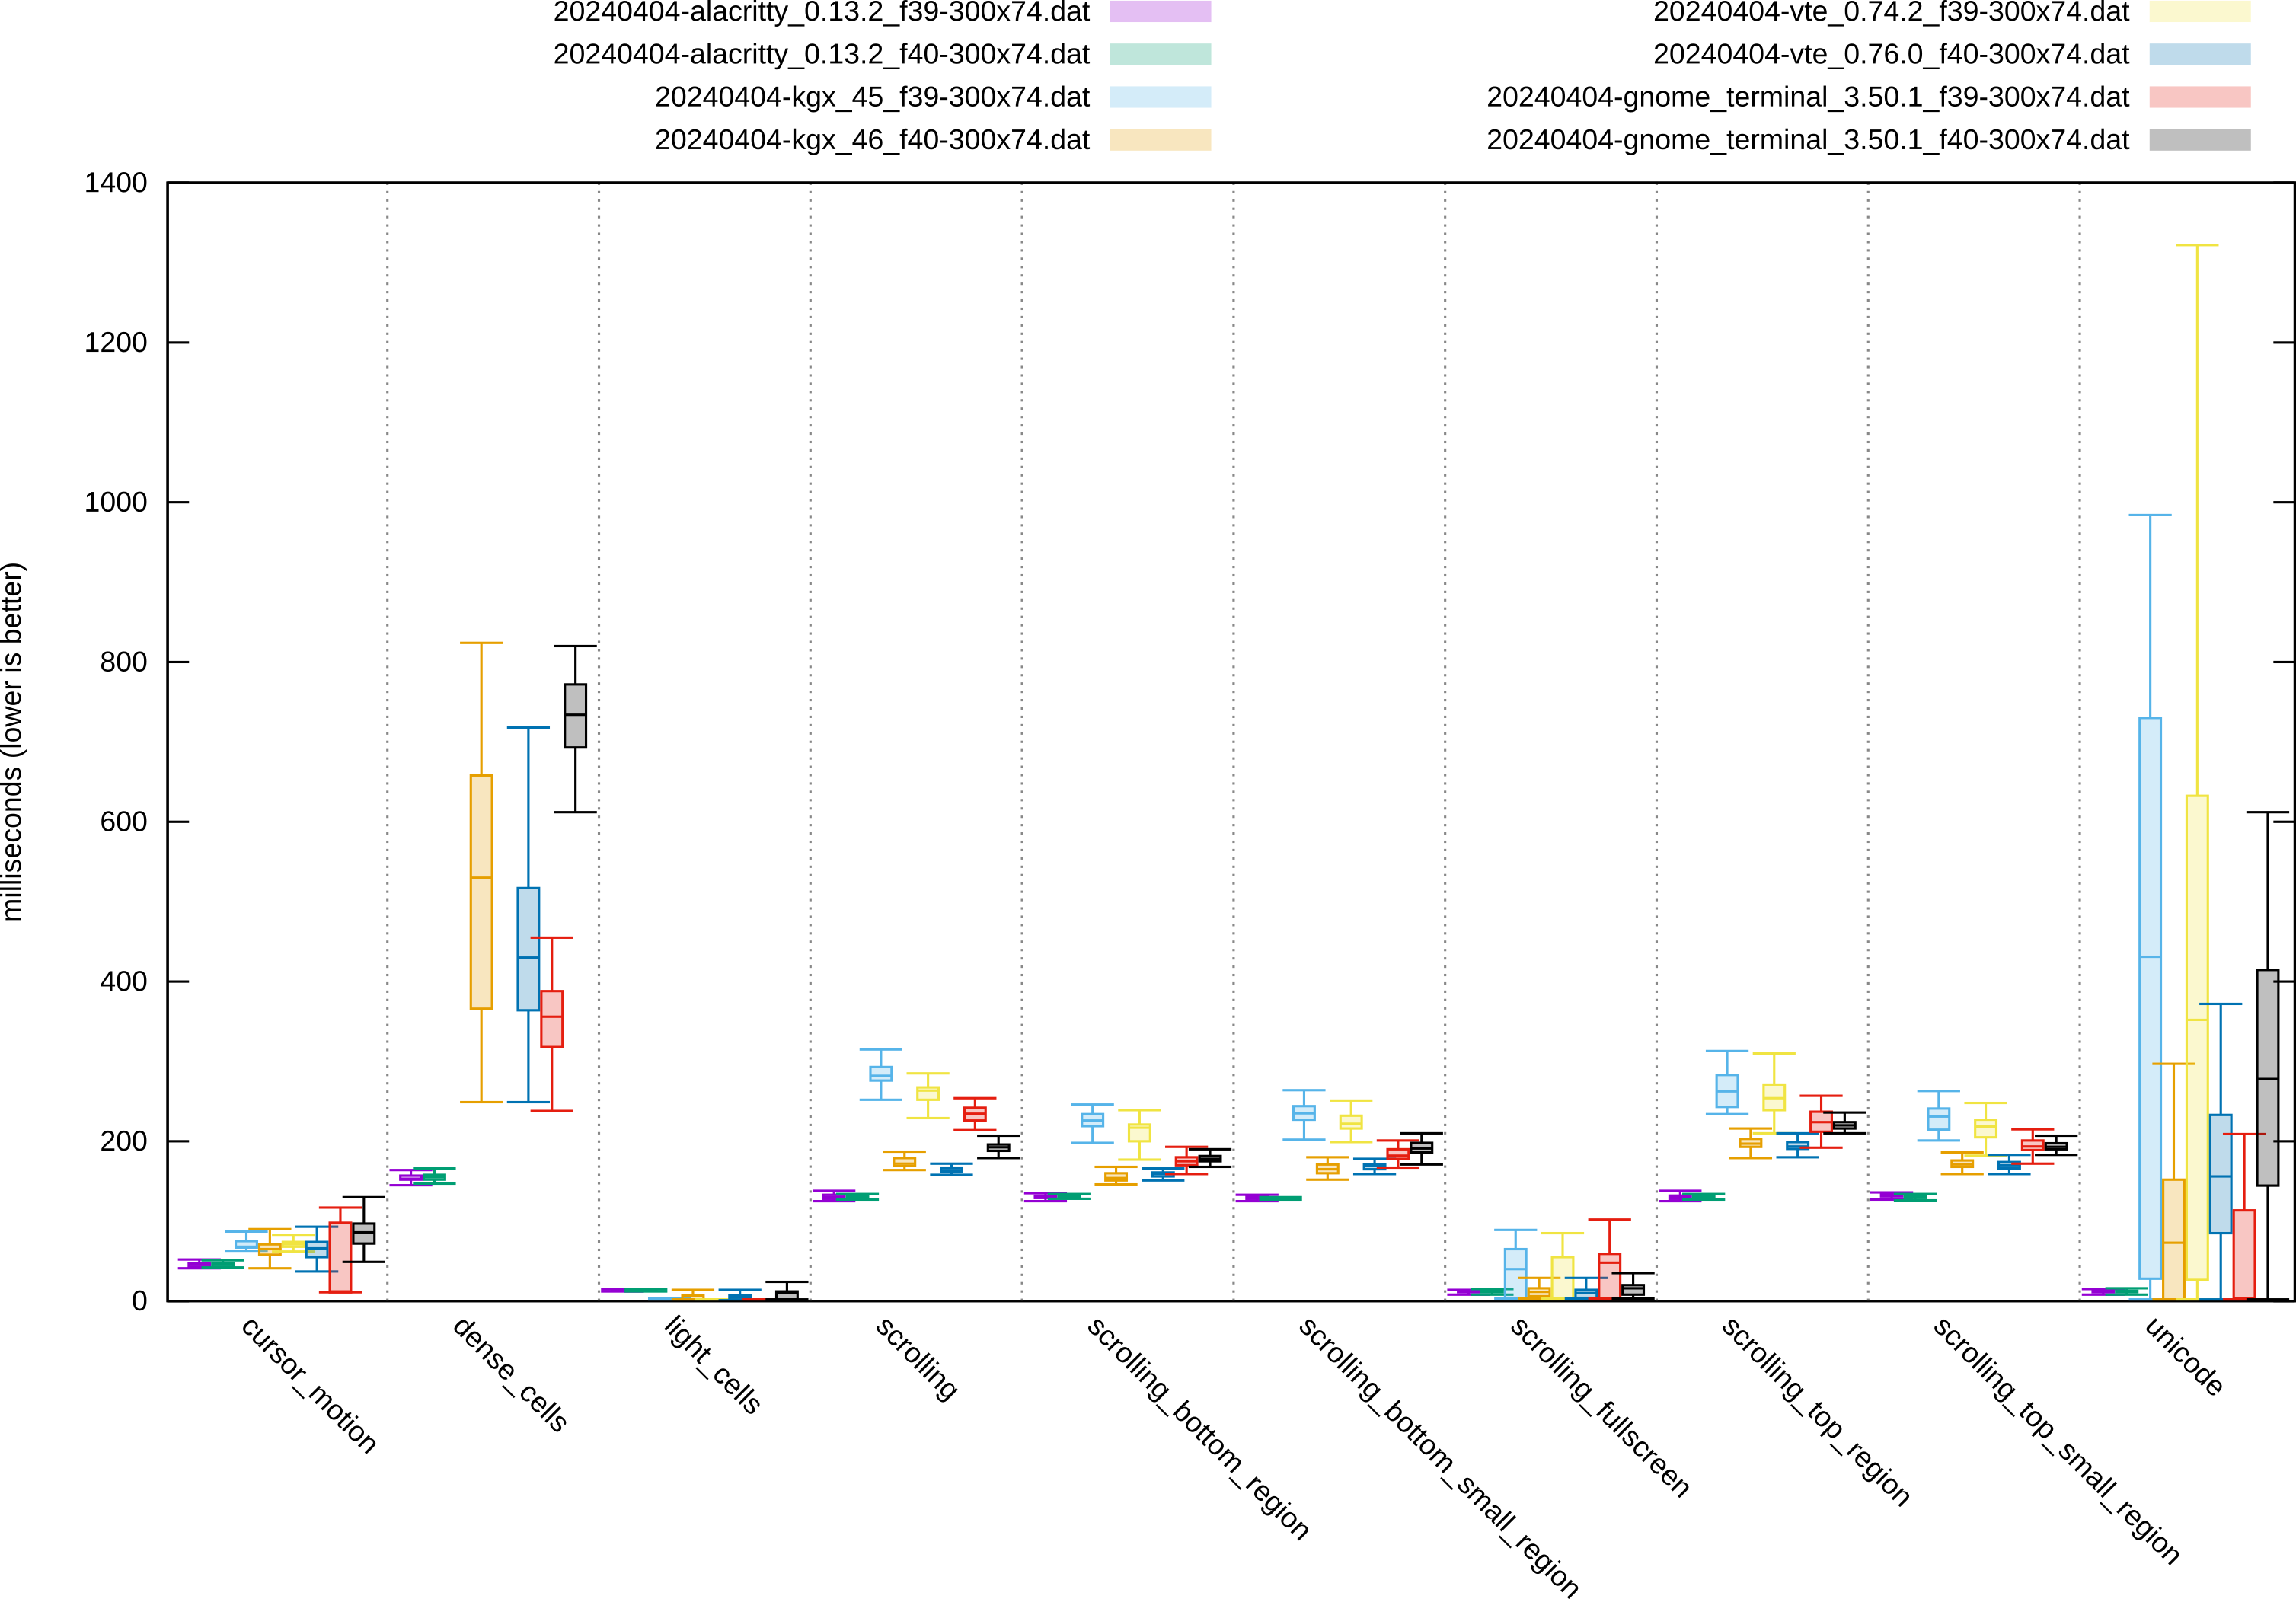
Note that I omitted two benchmarks from these results: dense_cells and unicode.
They are the main stress tests of vtebench that hit the terminal really hard.
Unfortunately, VTE still struggles with them and shows a huge spread, which pushes the rest of the results down and makes the plot less readable.
Open this to see the full results if you’re curious.
Conclusion #
VTE had a round of massive performance improvements in GNOME 46 which manifest as something you can really feel during normal terminal use. The input latency is down to almost matching the fastest terminals, even in a non-trivial neovim setup with lots of complexity on screen.
The remaining difference, at least on these test cases, is close to negligible. Some of it can be explained by VTE doing a bit more extra work for accessibility (enabled in GNOME Terminal and currently disabled in the GTK 4 terminals), scrollbar calculations, and other features.
If you’ve been avoiding VTE-based terminals due to sluggishness and input lag, now is the time to give them another chance. Just make sure you’re running VTE 0.76, which includes all of this goodness.
Huge thanks to the VTE maintainers and contributors for making this a reality, and congratulations on an awesome release!
P.S. If you’re curious about Ptyxis or the behavior of GTK’s NGL vs. NVK vs. GL renderers, they all perform similarly to the F40 VTE Test App results shown above. I did more extensive benchmarks of these a month ago, you can find them here.