See where your AI coding tokens go.


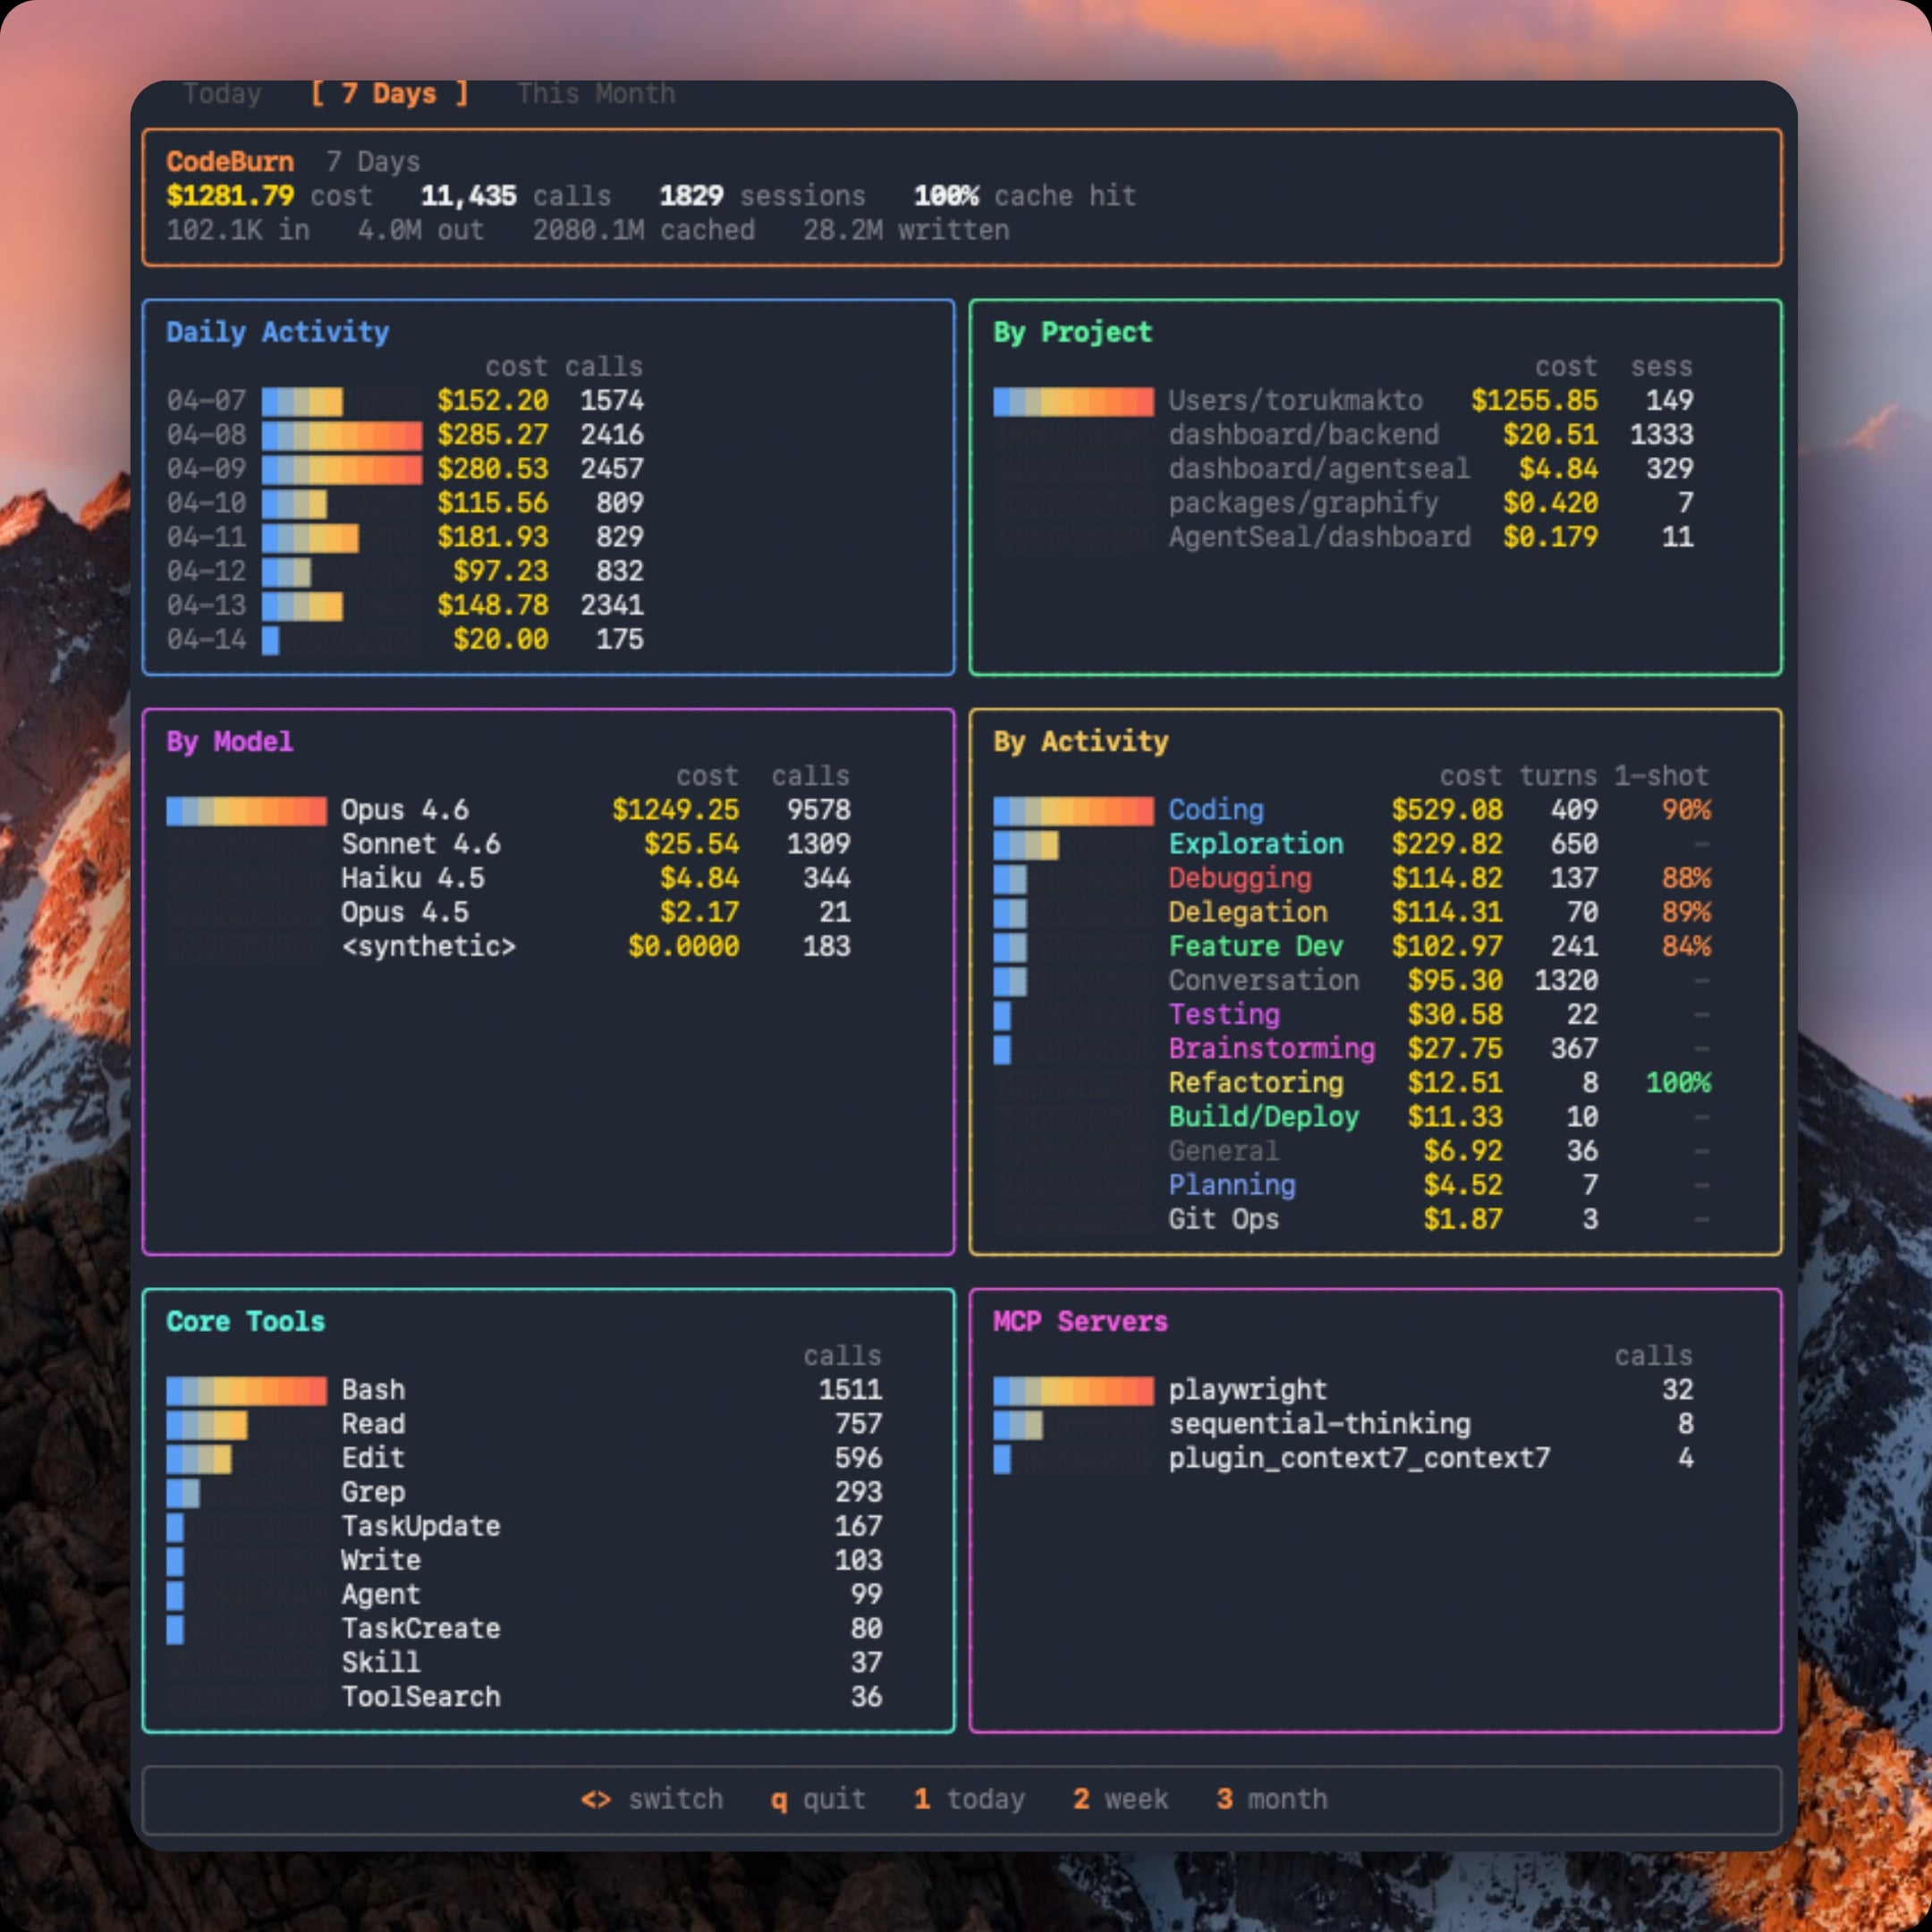
By task type, tool, model, MCP server, and project. Supports Claude Code, Codex (OpenAI), Cursor, OpenCode, Pi, and GitHub Copilot with a provider plugin system. Tracks one-shot success rate per activity type so you can see where the AI nails it first try vs. burns tokens on edit/test/fix retries. Interactive TUI dashboard with gradient charts, responsive panels, and keyboard navigation. macOS menu bar widget via SwiftBar. CSV/JSON export.
Works by reading session data directly from disk. No wrapper, no proxy, no API keys. Pricing from LiteLLM (auto-cached, all models supported).
Or run without installing:
- Node.js 20+
- Claude Code (
~/.claude/projects/), Codex (~/.codex/sessions/), Cursor, OpenCode, Pi (~/.pi/agent/sessions/), and/or GitHub Copilot (~/.copilot/session-state/) - For Cursor/OpenCode support:
better-sqlite3is installed automatically as an optional dependency
codeburn                    # interactive dashboard (default: 7 days)
codeburn today              # today's usage
codeburn month              # this month's usage
codeburn report -p 30days   # rolling 30-day window
codeburn report -p all      # every recorded session
codeburn report --refresh 60  # auto-refresh every 60 seconds
codeburn status             # compact one-liner (today + month)
codeburn status --format json
codeburn export             # CSV with today, 7 days, 30 days
codeburn export -f json     # JSON export
Arrow keys switch between Today / 7 Days / 30 Days / Month / All Time. Press q to quit, 1 2 3 4 5 as shortcuts. The dashboard also shows average cost per session and the five most expensive sessions across all projects.
CodeBurn auto-detects which AI coding tools you use. If multiple providers have session data on disk, press p in the dashboard to toggle between them.
codeburn report                      # all providers combined (default)
codeburn report --provider claude    # Claude Code only
codeburn report --provider codex     # Codex only
codeburn report --provider cursor    # Cursor only
codeburn report --provider opencode  # OpenCode only
codeburn report --provider pi        # Pi only
codeburn report --provider copilot   # GitHub Copilot only
codeburn today --provider codex      # Codex today
codeburn export --provider claude    # export Claude data only
The --provider flag works on all commands: report, today, month, status, export.
| Provider | Data location | Status |
|---|---|---|
| Claude Code | ~/.claude/projects/ |
Supported |
| Claude Desktop | ~/Library/Application Support/Claude/local-agent-mode-sessions/ |
Supported |
| Codex (OpenAI) | ~/.codex/sessions/ |
Supported |
| Cursor | ~/Library/Application Support/Cursor/User/globalStorage/state.vscdb |
Supported |
| OpenCode | ~/.local/share/opencode/ (SQLite) |
Supported |
| Pi | ~/.pi/agent/sessions/ |
Supported |
| GitHub Copilot | ~/.copilot/session-state/ |
Supported (output tokens only) |
| Amp | -- | Planned (provider plugin system) |
Codex tool names are normalized to match Claude's conventions (exec_command shows as Bash, read_file as Read, etc.) so the activity classifier and tool breakdown work across providers.
Cursor reads token usage from its local SQLite database. Since Cursor's "Auto" mode hides the actual model used, costs are estimated using Sonnet pricing (labeled "Auto (Sonnet est.)" in the dashboard). The Cursor view shows a Languages panel (extracted from code blocks) instead of Core Tools/Shell/MCP panels, since Cursor does not log individual tool calls. First run on a large Cursor database may take up to a minute; results are cached and subsequent runs are instant.
GitHub Copilot only logs output tokens in its session state, so Copilot cost rows sit below actual API cost. The model is tracked via session.model_change events; messages before the first model change are skipped to avoid silent misattribution.
The provider plugin system makes adding a new provider a single file. Each provider implements session discovery, JSONL parsing, tool normalization, and model display names. See src/providers/codex.ts for an example.
By default, costs are shown in USD. To display in a different currency:
codeburn currency GBP          # set to British Pounds
codeburn currency AUD          # set to Australian Dollars
codeburn currency JPY          # set to Japanese Yen
codeburn currency              # show current setting
codeburn currency --reset      # back to USD
Any ISO 4217 currency code is supported (162 currencies). Exchange rates are fetched from Frankfurter (European Central Bank data, free, no API key) and cached for 24 hours at ~/.cache/codeburn/. Config is stored at ~/.config/codeburn/config.json.
The currency setting applies everywhere: dashboard, status bar, menu bar widget, CSV/JSON exports, and JSON API output.
The menu bar widget includes a currency picker with 17 common currencies. For any currency not listed, use the CLI command above.
codeburn install-menubar # install SwiftBar/xbar plugin
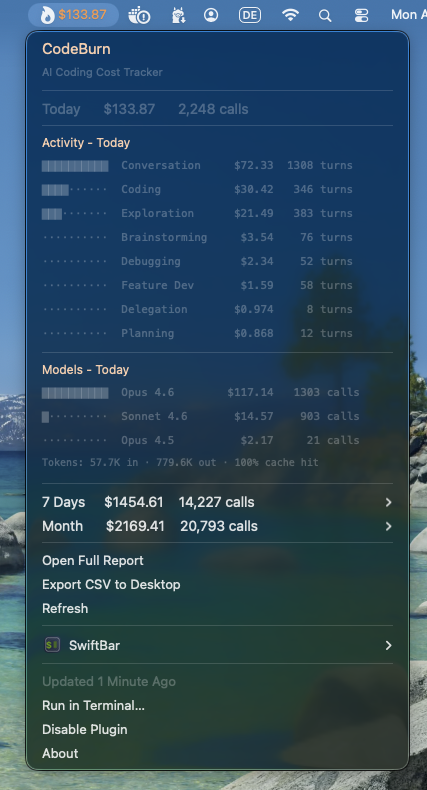
codeburn uninstall-menubar # remove itRequires SwiftBar (brew install --cask swiftbar). Shows today's cost in the menu bar with a flame icon. Dropdown shows activity breakdown, model costs, token stats, per-provider cost breakdown, and a currency picker. Refreshes every 5 minutes.
13 task categories classified from tool usage patterns and user message keywords. No LLM calls, fully deterministic.
| Category | What triggers it |
|---|---|
| Coding | Edit, Write tools |
| Debugging | Error/fix keywords + tool usage |
| Feature Dev | "add", "create", "implement" keywords |
| Refactoring | "refactor", "rename", "simplify" |
| Testing | pytest, vitest, jest in Bash |
| Exploration | Read, Grep, WebSearch without edits |
| Planning | EnterPlanMode, TaskCreate tools |
| Delegation | Agent tool spawns |
| Git Ops | git push/commit/merge in Bash |
| Build/Deploy | npm build, docker, pm2 |
| Brainstorming | "brainstorm", "what if", "design" |
| Conversation | No tools, pure text exchange |
| General | Skill tool, uncategorized |
Breakdowns: daily cost chart, per-project, per-model (Opus/Sonnet/Haiku/GPT-5/GPT-4o/Gemini), per-activity with one-shot rate, core tools, shell commands, MCP servers.
One-shot rate: For categories that involve code edits, CodeBurn detects edit/test/fix retry cycles (Edit -> Bash -> Edit patterns). The 1-shot column shows the percentage of edit turns that succeeded without retries. Coding at 90% means the AI got it right first try 9 out of 10 times.
Pricing: Fetched from LiteLLM model prices (auto-cached 24h at ~/.cache/codeburn/). Handles input, output, cache write, cache read, and web search costs. Fast mode multiplier for Claude. Hardcoded fallbacks for all Claude and GPT-5 models to prevent fuzzy matching mispricing.
CodeBurn surfaces the data, you read the story. A few patterns worth knowing:
| Signal you see | What it might mean |
|---|---|
| Cache hit < 80% | System prompt or context isn't stable, or caching not enabled |
Lots of Read calls per session |
Agent re-reading same files, missing context |
| Low 1-shot rate (Coding 30%) | Agent struggling with edits, retry loops |
| Opus 4.6 dominating cost on small turns | Overpowered model for simple tasks |
dispatch_agent / task heavy |
Sub-agent fan-out, expected or excessive |
| No MCP usage shown | Either you don't use MCP servers, or your config is broken |
Bash dominated by git status, ls |
Agent exploring instead of executing |
| Conversation category dominant | Agent talking instead of doing |
These are starting points, not verdicts. A 60% cache hit on a single experimental session is fine. A persistent 60% cache hit across weeks of work is a config issue.
Claude Code stores session transcripts as JSONL at ~/.claude/projects/<sanitized-path>/<session-id>.jsonl. Each assistant entry contains model name, token usage (input, output, cache read, cache write), tool_use blocks, and timestamps.
Codex stores sessions at ~/.codex/sessions/YYYY/MM/DD/rollout-*.jsonl with token_count events containing per-call and cumulative token usage, and function_call entries for tool tracking.
Cursor stores session data in a SQLite database at ~/Library/Application Support/Cursor/User/globalStorage/state.vscdb (macOS), ~/.config/Cursor/User/globalStorage/state.vscdb (Linux), or %APPDATA%/Cursor/User/globalStorage/state.vscdb (Windows). Token counts are in cursorDiskKV table entries with bubbleId: key prefix. Requires better-sqlite3 (installed as optional dependency). Parsed results are cached at ~/.cache/codeburn/cursor-results.json and auto-invalidate when the database changes.
OpenCode stores sessions in SQLite databases at ~/.local/share/opencode/opencode*.db. CodeBurn queries the session, message, and part tables read-only, extracts token counts and tool usage, and recalculates cost using the LiteLLM pricing engine. Falls back to OpenCode's own cost field for models not in our pricing data. Subtask sessions (parent_id IS NOT NULL) are excluded to avoid double-counting. Supports multiple channel databases and respects XDG_DATA_HOME.
Pi stores sessions as JSONL at ~/.pi/agent/sessions/<sanitized-cwd>/*.jsonl. Each assistant message carries token usage (input, output, cacheRead, cacheWrite) plus inline toolCall content blocks. CodeBurn extracts token counts, normalizes Pi's lowercase tool names to the standard set (bash -> Bash, dispatch_agent -> Agent), and pulls bash commands from toolCall.arguments.command for the shell breakdown.
CodeBurn reads these files, deduplicates messages (by API message ID for Claude, by cumulative token cross-check for Codex, by conversation/timestamp for Cursor, by session+message ID for OpenCode, by responseId for Pi), filters by date range per entry, and classifies each turn.
| Variable | Description |
|---|---|
CLAUDE_CONFIG_DIR |
Override Claude Code data directory (default: ~/.claude) |
CODEX_HOME |
Override Codex data directory (default: ~/.codex) |
src/
  cli.ts          Commander.js entry point
  dashboard.tsx   Ink TUI (React for terminals)
  parser.ts       JSONL reader, dedup, date filter, provider orchestration
  models.ts       LiteLLM pricing, cost calculation
  classifier.ts   13-category task classifier
  types.ts        Type definitions
  format.ts       Text rendering (status bar)
  menubar.ts      SwiftBar plugin generator
  export.ts       CSV/JSON multi-period export
  config.ts       Config file management (~/.config/codeburn/)
  currency.ts     Currency conversion, exchange rates, Intl formatting
  sqlite.ts       SQLite adapter (lazy-loads better-sqlite3)
  cursor-cache.ts Cursor result cache (file-based, auto-invalidating)
  providers/
    types.ts      Provider interface definitions
    index.ts      Provider registry (lazy-loads Cursor, OpenCode)
    claude.ts     Claude Code session discovery
    codex.ts      Codex session discovery and JSONL parsing
    cursor.ts     Cursor SQLite parsing, language extraction
    opencode.ts   OpenCode SQLite session discovery and parsing
    pi.ts         Pi agent JSONL session discovery and parsing
MIT
Inspired by ccusage. Pricing data from LiteLLM. Exchange rates from Frankfurter.
Built by AgentSeal.