By Simon White, Bloomberg markets live reporter and strategist
It’s getting a bit “number go up” in US equities. Despite the incessant advance, there are still several tailwinds to keep the rally intact. But that does not mean investors should become blasé, with a number of similarities emerging between the current market and the Dotcom bust in the 2000s.
Bulls versus bears in stocks slug it out with much more intensity than in bonds or other markets (except perhaps for gold). But bull markets can be particularly inflammatory as they have a habit of persisting for much longer than many believe possible. Whether you think that’s a good thing or not, it is what it is.
Nonetheless, even the most fervent bulls should be acutely aware that they are on a frozen lake, where they could be walking on thin ice long before the surface betrays any signs of it.
The ice might be showing early signs of weakening, with several examples of market over-extension developing that investors should be mindful of. Three of the most notable are:
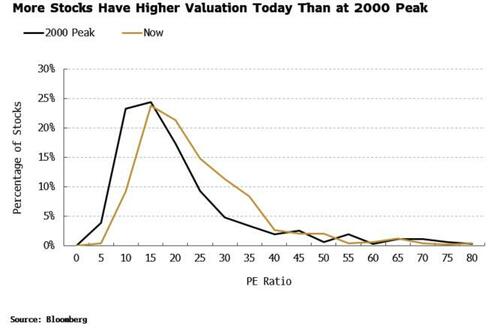
- More stocks with higher P/Es than at the 2000 peak
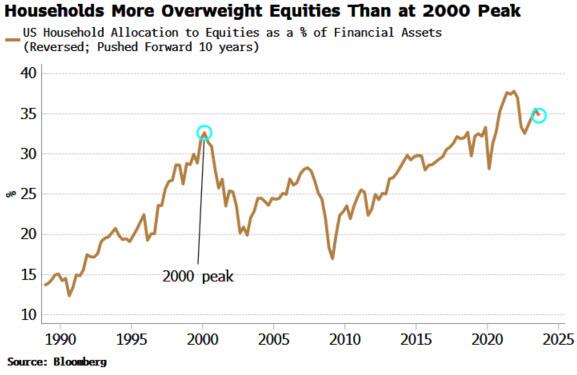
- The household sector is more overweight equities than it was at the Dotcom top
- Idiosyncratic behavior in the tech sector is driving a wedge between high dispersion in the S&P and low implied volatility, similar to the late 1990s
Start with valuations. The S&P’s P/E ratio was around 30 in early 2000, versus about 25 today. But as always, weighted averages mask what is going on under the surface. If we look at the distribution of P/Es across the index, today’s market is similar to the 2000 peak, except that the current distribution has a fatter right tail, i.e. there are more stocks with P/Es higher than the average.
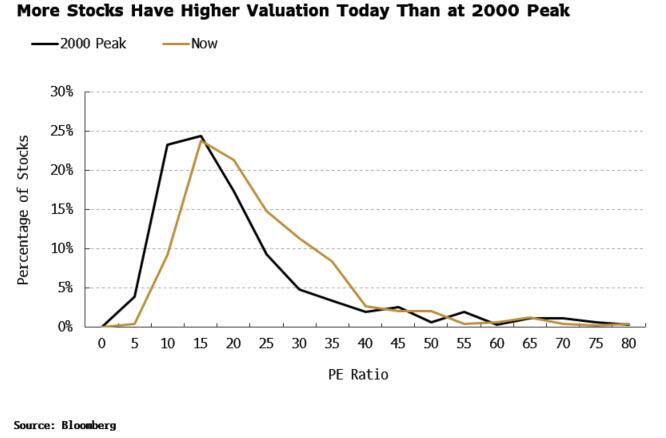
Valuation is about as much use as a helicopter ejector seat when it comes to timing, but as overvalued stocks become more widespread it means when the market does start to sell off it is primed to be more pronounced.
As in any bull market, there are those who are late to the party and start buying only when they can’t take the FOMO any more. That was certainly the case in the 1990s when it seemed if every man and his dog was a tech utopian and a budding Warren Buffett.
However, the household sector in the US is more invested in equities, relative to its total holdings in financial assets, than it was in 2000.
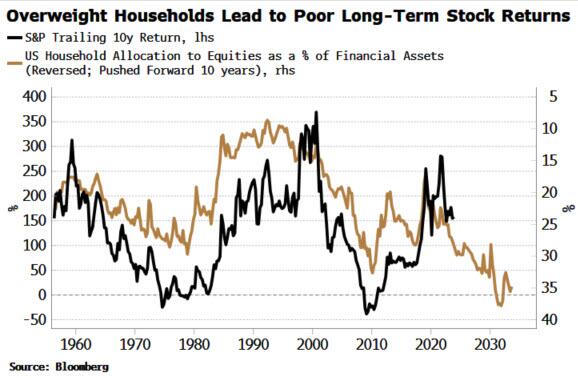
That’s not good for the market outlook. The chart below takes the household allocation to equities above and inverts it and pushes it forward by ten years, and adds the 10-year rolling return for the S&P. As can be seen, high household allocations to stocks is a portent of poor long-term returns. This highlights that even if the bull market persists for a while yet, it is unlikely to be one with especially juicy returns (even more so in real terms).
Of more concern is the growing gap between dispersion and implied volatility. Dispersion measures the difference between individual stocks’ variance and that of the index. Dispersion is high at the moment as some stocks, mainly in the tech sector, have a high variance, while the index overall does not.
When dispersion is high, selling it is attractive, i.e. selling index vol and buying vol on individual stocks. That has the effect of pinning the index, which means that as the AI-theme keeps driving tech stocks higher, the remaining stocks in the index must fall, dampening the overall correlation, and in turn keeping index vol capped.
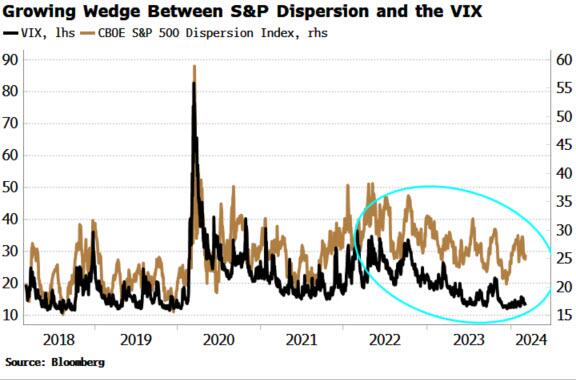
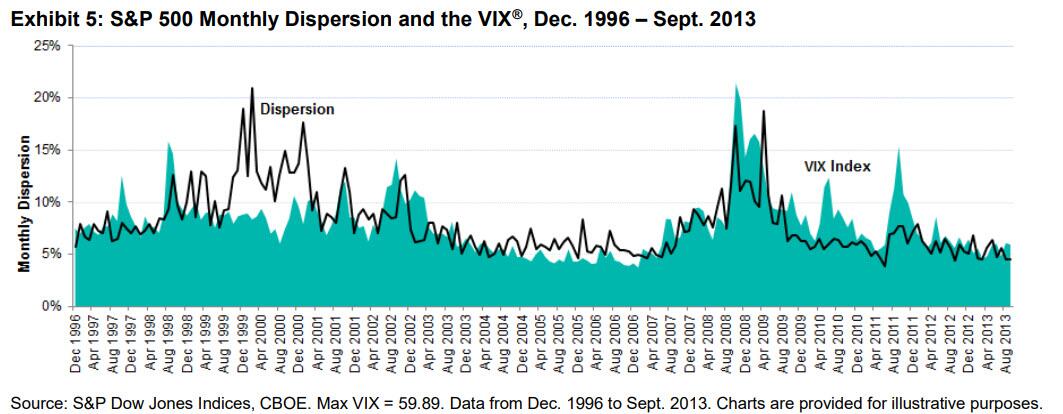
A similar gap between dispersion and the VIX opened up in the late 1990s and early 2000s as tech was skyrocketing while the rest of the market was comparatively serene. As S&P Global puts it, dispersion captures periods where only a portion of the market bubbles or crashes.
This is not a sign of an imminent decline, but it shows that while the market is not yet in bubble territory, the tech sector may already be.
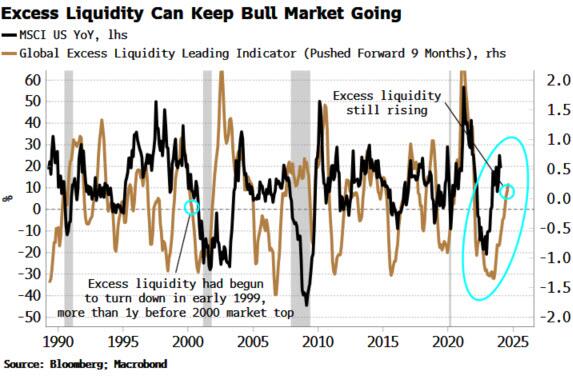
Nevertheless, there are some potent tailwinds still in play for today’s market. Most important is excess liquidity, the difference between real money growth and economic growth. That is still elevated and rising, and points to further advances in the stock market over the next 3-6 months. Excess liquidity in the time of the tech bubble, on the other hand, had begun to turn down in early 1999, more than a year before the market topped.
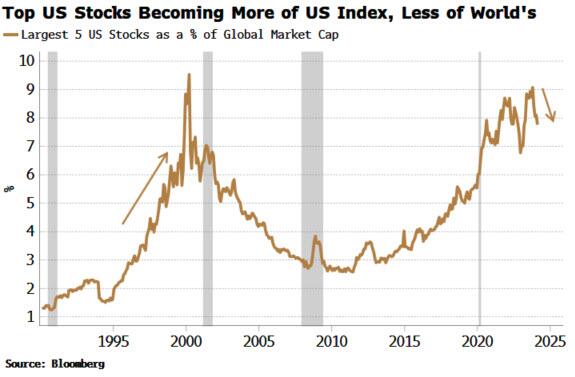
Much has been said about concentration risk, with a handful of stocks driving returns and accounting for a disproportionate size of the index. But that alone has not historically led to market underperformance. Further, the largest US stocks’ market cap is actually falling relative to the global total. This measure spiked to 9.5% at the market peak in 2000, but is lower at 8% today and falling.
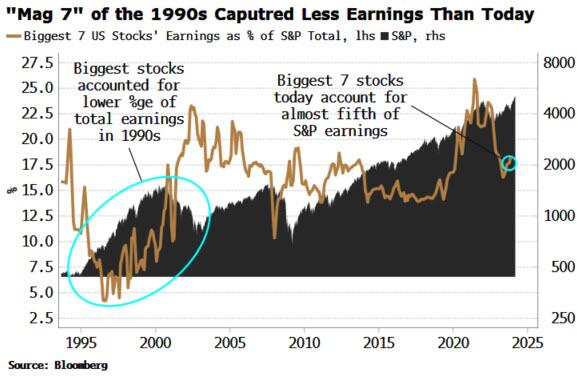
More importantly, the largest stocks today are longer-established businesses with more solid records on revenue and earnings growth. In the late 1990s, the largest seven US stocks accounted for 7-10% of S&P 500 earnings. Today that proportion is closer to 18% and is climbing.
In the late 1990s, there were companies IPO-ing with no revenue or earnings, and which hadn’t been around long. Companies like Nvidia and Microsoft have long track records and viable businesses. Moreover, there are signs of AI-infrastructure build-out beginning to broaden the range of the firms benefiting from the new technology. The stock prices of AI firms will suffer if heightened expectations don’t match up to reality, but they are very unlikely to go to zero, as happened to many companies in the Dotcom bust.
Still, there are undoubtedly signs of excess across markets. Bitcoin is trying to re-exit the Earth’s atmosphere, now close to its all-time highs. In crypto overall, people are starting to buy and close their eyes, with the re-emergence of ever more deranged ways to suck up willing liquidity (yes you, Dogwifhat). Private credit is another area that should give any asset bull pause for concern, given its opacity and the likelihood some of the shoddiest loans are coalescing there, away from the market’s prying eyes.
Stocks are short-term overbought, yet there are few reasons to suggest they won’t keep grinding higher with excess liquidity as a support over the medium term (3-6 months). Nonetheless, there is a rising number of reasons discussed above that should unnerve bulls. Fortunately, downside hedges have been cheapening as implied vol falls, with a 5000 strike put on the S&P expiring at the end of the year costing a little more than 3%.
Fearlessness is carelessness. Bulls walking across the ice should start to watch their step more closely.